One way to decompose the GDP is in terms of its expenditure components, Y ≡ C + I + G + NX. I like to write "≡" instead of "=" to remind myself that this decomposition is measurement, not theory.


In what follows, consumption is measured in terms of nondurables and services only--I add consumer durables with private investment. The data is inflation-adjusted, quarterly, and I report year-over-year percent changes. I'll start with recent history (since 2010) and then later look at a longer sample (beginning in 1960).
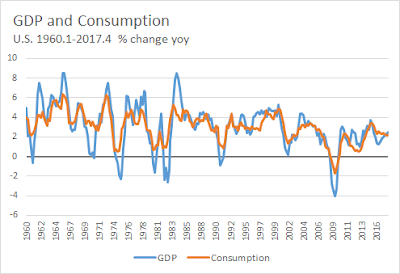
Let me begin with GDP and consumption. I like to study consumption dynamics because I have some notion of Milton Friedman's "permanent income hypothesis" in the back of my mind. The idea is that individuals base their expenditures on nondurable goods and services more on their wealth (a stock) rather on income (a flow)--at least, to the extent they can draw on savings and/or access credit markets. To a first approximation then, one could interpret consumption as the trend for GDP. According to the theory, consumption should respond less strongly to perceived transitory changes in income (GDP) and more strongly to perceive permanent changes in income (GDP). In any case, here's what the data looks like for the U.S. since 2010.

GDP growth since the end of the Great Recession has averaged about 2%, consumption growth somewhat less. Two things stand out for me. The first is the anemic consumption growth from 2011-early 2014 and in particular 2012-2013. Why were American households so bearish? (Note that the unemployment rate is declining throughout this sample period.) Things seemed to turn around in 2014, but then tailed off somewhat in 2015. Coincidentally (or not), that was the year in which the Fed talked out loud about "lift off" -- raising its policy rate for the first time from 25bp where it had remained since 2009. The second is where we're at now. Yes, GDP growth has rebounded somewhat since early 2016, but we're still well within the bounds of recent history (so, no sign of some impending boom). The tale is told by consumption growth, which has remained steady at about 2%.
The following diagram plots private investment spending, decomposed into residential, non-residential, and consumer durables spending (note that the scales vary across figures).

The growth rate in consumer durables spending is relatively stable in this sample period, averaging between 5-10%. Residential investment, which collapsed during the Great Recession, did not turn around until late 2011. It has grown as rapidly as 15% in 2012-2013 (the years of anemic consumption growth cited above), but has slowed down markedly since 2016. In terms of non-residential investment, it was surprising (to me) the weakness it displayed, especially in 2016 (this may have been due, at least in part, to the collapse in oil prices, which held back investment in the energy sector.)

Well, here's a picture for you. Government purchases of goods and services actually declined for most of this sample period. (Government investment consists mainly of structures and computer hardware/software (see here) and accounts for about 20% of government purchases.) I've been reflecting a lot on this picture lately because it looks different from what many may think, and also, it looks different from historical behavior (as we'll see below).
For completeness, I include export and import growth. Nothing too interesting here.

What does this same data look like from a longer time perspective? I reproduce the four figures above starting in 1960.

This is really a striking figure, in my view. There are so many things that catch my eye. The first and most obvious is the decline in volatility beginning around 1985 (this is the so-called Great Moderation). Less obvious, but something worth noting is an apparent growing asymmetry associated with the Great Moderation. In particular, growth recessions seem roughly as severe as they've always been. What's missing are the sharp growth booms. Third, it seems to me that consumption growth was much less volatile than GDP growth prior to 1985. Andrew Spewak and I discuss this here. One possible explanation is that business cycle downturns are generally expected to be much more persistent than in the past (why this might be so would be an interesting question to investigate). Finally, and perhaps most important, economic growth since 2000 has slowed down significantly. St. Louis Fed President Jim Bullard argues we are in a low-growth regime (see here). Is this a recurring phenomenon, as suggested by Schumpeter (see here)? How much of the slowdown is explained by a post WW2 transition dynamic?
Here is private investment spending across categories,

Again, the Great Moderation is evident, apart from the monumental collapse of residential investment spending in the Great Recession.

Like private investment, government investment is relatively volatile (though one wonders why this should be the case for government). The most striking aspect of this diagram is the collapse government spending in the immediate aftermath of the Great Recession. One can't help but wonder about the wisdom of such policy during such a period of economic weakness. For those in favor of reducing (G/Y), a more gradual policy would almost surely have been better (e.g., by letting Y grow into G, not by cutting G).
Finally, for completeness, here is export and import growth.

It's interesting that the Great Moderation shows up along this dimension as well.
If you have an economic theory that explains all these patterns, I'd be very interested to hear about it below.
---
ReplyDeleteThe most striking aspect of this diagram is the collapse government spending in the immediate aftermath of the Great Recession. One can't help but wonder about the wisdom of such policy during such a period of economic weakness
---
if the primary goal is effecting a transfer of political power to one's cronies, there's a certain wisdom in crippling the economy.
one might even go so far as to enlist the services of sympathetic foreign oligarchs.
and having secured political power in an era of 4% unemployment, abandoning one's opposition to deficits might represent a similar form of wisdom
ReplyDeleteVery off-the-cuff theory here. What you are seeing is an artifact of the slowing household formation which in turn stems from slower population growth a few decades prior.
ReplyDeleteThis has the general effect of reducing the contribution of housing and consumer durables to GDP as new households "tool-up" so to speak. The result is there is less booming associated with strong economic conditions: rapid job growth and relatively loose monetary policy.
It also leading to less investment in schools and teachers which slows government expenditure.
Just riffing here but maybe we could think of a simple growth model in which in n falls. I feel like d should fall to because of some compositonal effects but I don't have that worked out yet so lets just stick with n.
Now suppose that recessions are periods in which capital formation is constrained. Then in because n is lower the rise in MPK due to a recession is much lower. Thus the investment boom is greatly ameliorated.
As a fellow admirer of Schumpeter (1939), I'd look for the answer there. He argues that
ReplyDelete(i) innovators ("entrepreneurs) are not risk-bearers, instead they lose other people money (Ch. III.C)
(ii) "Innovation is not only the most important immediate source of gains [and private capital formation], but also indirectly produces, through the process it sets going, most of those situations from which windfall gains and losses arise" (Ch. III.C)
(iii) the modus operandi of innovation is bank money creation: banks issue to the innovators new means of payment created ad hoc and this is what allows the innovators to operate and effect change on the economy. Thus funds are not withdrawn from existing "old" firms, but with the expansion of the money supply the purchasing power of the funds available to the "old" firms declines. Part of the process of innovation thus involves a complete readjustment of prices to a new reality, as the successful innovators have their bank credit lines regularly renewed. (ch. III.D)
(iv) As a result per Schumpeter the process of innovation and growth is wholly dependent on the quality of the banking system and its ability to direct funding to those who will be successful innovators. Because this "requires intellectual and moral qualities not present in all people who take to the banking profession ... bankers may, at some times and in some places, fail to be up to the mark corporatively ... [and] the failure of the banking community to function in the way required by the structure of the capitalist machine accounts for most of the events which the majority of observers would call 'catastrophes.'" (Ch. III.D)
In short, if you want a theory of why Schumpeterian growth booms are failing to appear, Schumpeter would tell you to take a very close look at how the structure of banking has changed. Since one of the most basic themes of modern financial history is the displacement of banks by "market-based" finance, that's probably a very good first place to look.
And on that note let me engage in some shameless self-promotion by posting a link to a paper that I think you've already seen, David.
Current draft (with some framing based on the sociology literature): https://papers.ssrn.com/sol3/papers.cfm?abstract_id=3120187
Older draft (for those who will gag on the sociology aspects of the paper): https://papers.ssrn.com/sol3/papers.cfm?abstract_id=2766693
Carolyn Sissoko
P.S. Schumpeter goes on to give an innovation-based theory of the interest rate that ties in with money markets, and argues that this is distinct from the capital markets interest rate with which we are all familiar. His effort to explain the connection between the two in Chapter IV is fascinating, even brilliant, but eventually at least for me becomes rather hard to follow.
David, just armchair theorizing here, but could the volatility in government spending have to do with state-government spending? If so, it might make more sense why it bounces around so much.
ReplyDelete