Some economists believe--were trained to believe, I would say--that the lacklustre performance of the labor market is easy to explain: there is a lack of demand. Just ask firms why they're not hiring: a lack of product demand frequently tops the list reasons provided.
I'm not sure that economists can rely on answers like this to identify the type of aggregate shock that is afflicting the economy. Think about the original multisector real business cycle model of Long and Plosser (JPE 1983). A negative productivity shock to one sector in their model economy could lead to a decline in the production and employment in many sectors of the economy. This is because firm level production functions use the intermediate goods of many sectors as inputs into their own production processes. To an individual producer, it would appear as the demand for his product is declining. And he would be correct. This lack of demand, however, bears no relation to the concept of "deficient demand" in the Keynesian sense.
In any case, let us take this deficient demand hypothesis seriously for the moment. Then I want to ask how this hypothesis might be reconciled with the labor market data I present below.
The first diagram plots the average monthly flow of workers between employment and unemployment (all data is from the U.S. Current Population Survey). The red line plots the EU flow (the flow of workers who made a transition from employment to unemployment). Leading up to the recession (shaded area), we see that in a typical quarter, roughly 1,750,000 workers per month exited employment into unemployment.
The blue line plots the UE flow (the flow of workers who made a transition from unemployment to employment). Leading up to the recession, we see that in a typical quarter, roughly 2,000,000 workers per month exited unemployment into employment.
When the recession hits, there is a large upward spike in the EU flow, as one would expect (people losing their jobs and becoming unemployed). This part seems consistent with the deficient demand hypothesis. However, look at what happens to the UE flow. While it does not rise as sharply as the EU flow, it rises nevertheless...and continues to remain high even as the EU flow declines. Is this surge in job finding rates*(see update below) among the unemployed consistent with the deficient demand hypothesis?
Note: the y-axis on the graphs below should read "thousands," not "millions." (Thanks to himaginary).

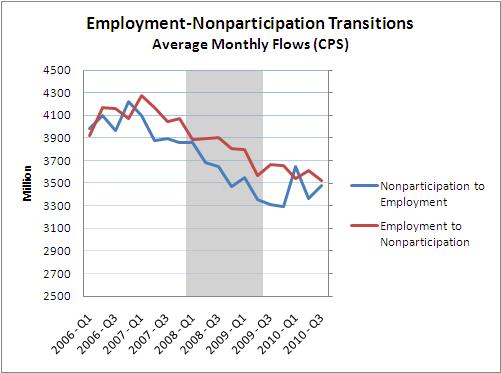
The next diagram plots the transitions between unemployment and nonparticipation (not in the labor force). The blue line denotes the UN flow (the flow of workers from unemployment to nonparticipation) and the red line denotes the NU flow (the flow of workers from nonparticipation to unemployment).

As you can see, these monthly flows are huge. And as one might expect, the UN flow rises dramatically during the recession. These are "discouraged workers;" and the phenomenon seems consistent with the deficient demand hypothesis.
But again, the surge in discouraged workers appears to be more than offset by a surge in "encouraged workers." How is this consistent with the deficient demand hypothesis?
It seems to me that this sort of data appears to be more consistent with an increase in reallocative activities in the labor market, rather than deficient demand. But maybe not. And if not, then I am curious to know what sort of stories people might tell to square their pet hypothesis with the data above.
Addendum: 11 Dec 2010
Nick Rowe asks about the NE and EN flows during this period. Here is the data:
In the following diagram, I plot the transitions into and out of employment. To do this, I define nonemployment = unemployment + nonparticipation.

Update: December 21, 2010
I have to admit to being puzzled by many of the responses I received on this post. And then I came across this comment on my post by Brad DeLong: Department of Huh? I suddenly see what appears to be confusing people; in particular, the claim I make above (starred) about the surge in job finding "rates." This statement definitely belongs in the Department of D'oh!
Let me explain what happened here. When looking at labor market data, I usually deflate all series by some population measure. And so, I construct objects that I call the employment rate, the unemployment rate, the job finding rate, and so on. Perhaps I should call them "ratios" instead of "rates." In any case, for the purpose of this blog post, I chose to post levels. There is clearly a surge in the UE flow. And of course, there is also a surge in the job finding "rate" when one defines this object as UE/P (the conventional definition of this rate is UE/U). Mea culpa for the confusion.
Having said this, my typo in no way detracts from the substantive question I raised: Are these (level) flows consistent with the deficient demand hypothesis?
The data shows a large increase in the EU (job losers) and UN (discouraged worker) flows. It seems easy to understand these flows in the context of a deficient demand story. What I was trying to get people to do, however, was to square this same story with the large increase in the UE (job finders) and NU (encouraged worker) flows. How does depressed demand, leading to reduced job openings, also encourage more workers to look for work? It's an interesting and legitimate question, I think. And the answer is not obvious.
I expressed a view that the phenomena in question might be difficult to square with a deficient demand story and invited readers to share their thoughts on the matter; i.e., perhaps I was missing something. I want to thank everyone who responded thoughtfully to the question I posed.
David,
ReplyDeleteAs you know I follow the Austrian theory here, so the reallocation story seems very natural to me.
I just wanted to ask - do any schools that you are aware of still teach this demand deficiency story? Or is this an area of macro research? I don't have a macro economics background at the Ph.D. level so I just don't know.
Well, while my reading of the graphs makes me think your point will hold up, it is still worth pointing out that what care about is rates of migrations, not the numbers.
ReplyDeleteThe fact that the number of migrations from U to E picked up in the recession could just reflect the greater number of people in state U.
On the other hand, it is certainly undeniable that the rate of migrations from E to U increased substantially in the recession.
Prof J:
ReplyDeleteThe basic deficient demand story, as embodied in the Keynesian Cross, is still taught widely.
A more sophisticated version of this theory, based on multiple equilibria (and arguably more consistent with Keynes' own interpretation of the phenomenon) is no doubt still taught in graduate school. Steve Williamson has wondered aloud why this branch of the theory remains relatively unpopular:
http://newmonetarism.blogspot.com/2010/08/what-happened-to-coordination-failure.html
There are other ways to interpret deficient demand like phenomena. Standard neoclassical models subject to "news shocks" for example (leading to waves of rational optimism/pessimism). I construct a version of this type of model here:
http://andolfatto.blogspot.com/2010/07/interpreting-recent-movements-in-money.html
Adam P: Your point about rates versus levels is well-taken. But I think that levels might be more relevant for the question I am asking here. If the UE flow increases, even if the rate UE/U remains unchanged, this does not change the fact that there are more U finding employment. I am asking how this is possible if there are no jobs available, as is commonly asserted.
ReplyDeleteInteresting stuff.
ReplyDeleteThe surge in "encouraged workers", your last chart, is almost certainly the result of a nearly equal collapse in the rate of "Not In Labor Force" -> "Employment", see the chart at the top of page 5 here:
http://www.rooseveltinstitute.org/sites/all/files/stagnant_labor_market.pdf
Also in there is that the unemployment and underemployment rates are up across all occupations in addition to all industries, implying shifts in the demand for occupational skills, which could show up as a problem in all industries, aren't triggering this.
David: What's happening to the flows between Nonparticipation and Employment? NE, and EN?
ReplyDeleteI have not peeked at the data. Honest! Here's my deficient AD prediction: NE falls, and EN rises, as the economy enters the recession.
My comment didn't get left before. Boo.
ReplyDeleteNick is right, the fall in N->E is almost identical to the rise in N->U. Check out the chart at the top of page 5:
http://www.rooseveltinstitute.org/sites/all/files/stagnant_labor_market.pdf
Nick and Rorty:
ReplyDeleteNeither of you are answering the question I posed.
But you ask a good question about the NE and EN flows. My recollection is that these both decline; if so, you are half right, Nick. I will post this data as an addendum on Monday. Thanks to both of you. (In the meantime, let me know if you have an answser to the question I posed).
Aha! I was right about NE falling. Thanks rortybomb! I couldn't see any picture of EN in that paper though. Maybe I missed it.
ReplyDeleteI do find the rise in UE puzzling. It does seem to go against the deficient demand story. As Adam says, the rise in UE could be consistent with a fall in UE/U (i.e the probability of an unemployed worker getting a job falls, but there's just a lot more of them unemployed).
But even so, the gross rise in UE is still not what I had expected. Maybe high quality workers losing their jobs, and getting re-hired at worse ones? Or part time? Or self-employed? Dunno.
Nobody believes in the simplistic version of the deficient demand hypothesis in which there are literally "no jobs available." In a recession, there are fewer jobs than usual available, because more potential jobs are below the margin of profitability when demand is weak. There is always search and reallocation going on, but searches by unemployed workers take longer when there are fewer firms demanding workers. To me these data seem quite consistent with the deficient demand hypothesis. As Adam noted, when the unemployment rate rises, there are more unemployed who can make the transition to employment. I'm fairly certain that their average transition rate is lower, even though total transitions are rising.
ReplyDeleteMore important, perhaps, take the information on both of these graphs in connection with the fact cited by Rortybomb above, and do the arithmetic. The conclusion is that total transitions to employment (UE + NE) went down during the recession. Of course, I already knew that from the JOLTS hires data and the Business Employment Dynamics job creation data. So I will invert the original question: if total transitions to employment are falling, how is that not consistent with deficient demand?
this is bizarre. beyond the census hiring, trillions of dollars were pumped into the system as a corrective.
ReplyDeletei chatted once with a timber industry advocate, we were talking about the severity of the ecological stress world-round. i told him we were in a deepening extinction crisis. he demanded to know of a species that had gone extinct in the modern era. he was serious! his people had been fighting against the endangered species protections for ages, and here he was talking as though there was no such thing.
plus the census hiring, and neither chart says who was getting hired, where, for what pay.
Andy: Dunno. I think David's got a point. The very simplest deficient demand story goes like this:
ReplyDeleteFirms lay off workers, and stop hiring. So EU + EN rises, and UE + NE falls. What precisely happens between N and U is less obvious.
The rise in UE does not fit this simple story. Sure, there's always search and turnover, so UE won't drop to zero. But why does it rise? Why are firms hiring more?
Maybe firms aren't hiring more. Maybe UE rises, but NE falls more, so that UE+NE falls. Story: good quality experienced laid-off workers get the low-wage jobs that the inexperienced new entrants would have got.
That's my (crappy) answer to your question David. But it is worth something, because even though I have now peeked at the NE graph Rortybomb posted, I didn't look at the scale on the axis. So I don't know if UE+NE fell. So, this is a genuine "prediction" on my part.
I'll grab my data later this weekend and check out your question. (Nick y-axis was in % of N for the month.) My suspicion at the time was that NU increased in part because of young people and other new entrants. I can't think of them as particularly encouraged when the median and mean in increasing.
ReplyDeleteMy speculative thoughts on that flow channel was influenced over the summer by:
http://www.bls.gov/opub/ils/pdf/opbils82.pdf
Which gave me that both young people were showing the highest nominal increase in unemployment and also that older workers weren't leaving the labor force at historical rates - a drop in UN perhaps triggered by retirement security issues.
I haven't tried to sort out Rortybomb's charts yet, but I'm taking his verbal statement at face value and combining it with the information in these charts, and that combination leads to the conclusion that UE+NE fell during the recession, which is consistent with what I know from other sources.
ReplyDeleteWhy does UE rise? Because there's so much more U, so firms can hire from the pool of U rather than having to reach out and recruit from N. The model in my head is that, if you're a firm looking for a worker, you first try to hire from U (i.e. the people that are knocking on your door asking for a job), but if you can't find someone qualified, you market the position more aggressively and hire from N. So naturally when U starts to contain lots of people qualified for lots of positions, UE goes up and NE goes down.
Let's define another transition called EE, where you remain in E but change jobs. Then total hires is UE+NE+EE. We know from other data sources that total hires go down during recessions. So UE+NE will go down unless EE falls sufficiently to offset the decline in total hires. But we also know that separations (EU+EN+EE) rise during recessions, so it seems unlikely that EE would fall enough to offset the decline in hires. (In other words, how plausible is it that the only reason total hires go down during a recession is that fewer people are changing jobs?)
If I'm reading the the graph correctly, the rising UE may have a simple explanation. In YE 2007, a flow of 2m of a stock of 7m unemployed were finding jobs on a monthly basis, or 29%. The number for 2009 was 2.5m of 14.3, or 17%.
ReplyDeleteSo, one could say that the monthly flow of unemployed finding jobs fell by roughly 40% -- a smaller amount scooped from a bucket twice as big shows up as a rise in the absolute numbers. The question is, did this also happen in the 1980-83 recessions seen as a whole? BTW, in that recession, the "bucket" of unemployed only grew by about 40%.
Also, a great deal of the UE flow may have occurred to "part time for economic reasons" jobs. So the true "full time" UE flow might have been much less than 17%.
(I see from Krugman's chart that separations actually fell during the recent recession, although not until near the end. Nonetheless it seems implausible to me that job-changers account for the entire decline in hires.)
ReplyDeleteI am not an economist, but from what I understand of the deficient demand theory it is based on spending = income.
ReplyDeleteY = C+I+G+(X-M)
If the private domestic sector wants to save/delever and the country is running a CAD, then unless the budgetary deficit makes up the difference, then spending falls, inventories build up, unemployment rises, and income falls.
As Richard Koo has been pointing out, this is a balance sheet recession, and until the private domestic sector rebuilds its balance sheet, then exports and/or a budgetary deficit must fill in the spending gap if the economy is to go forward and unemployment fall.
Am I missing something here?
Tom Hickey:
ReplyDeleteOne thing to keep in mind is the equation Y = C+I+X-M is not a theory; it is an accounting identity (i.e., it is true by definition and hence, it is true for any theory under consideration).
As for the basic story you relate, most people are likely to agree that there is some element of what you describe happening right now in the economy. What you might be missing is the possibility that there are other factors that are even more likely to contribute to sluggish employment growth in the foreseeable future. I have emphasized labor market adjustment costs here, but there may be other factors as well.
"Is this surge in job finding rates among the unemployed consistent with the deficient demand hypothesis?...And as one might expect, the UN flow rises dramatically during the recession."
ReplyDeleteShould have answered this first, but UE collapses as a percent of U. UN interestingly decreases a bit as a percent of unemployed. (The increase in UU is consistent with the rise in the mean/median of unemployment duration.)
You can see these both from the gov monthly figures or Shimer's quarterly data he compiles, Figures 5,6,7 in that document, or this jpg:
http://rortybomb.files.wordpress.com/2010/09/out_of_unemployment_2.jpg
The unemployment population more than doubles during 12/07 to 8/10, from 7.7m to 14.9m, so we should, on the first approximation, expect that the number of UN should double as well, which it doesn't do from your chart. Your UE total number goes up ~20%. That's a huge fall compared to the doubling of the population.
In general, I think rates are better than levels; the levels are changing very quickly and very dramatically across E, U and N during a short period here.
David, thanks for your reply. Yes, there are other factors. The other major factor I see is the effect of global labor arbitrage and the rise of emerging economies. Productive investment is flowing abroad and with it jobs. The US has been de-industrializing and financializing for some time. Service jobs and other jobs that can only be performed locally are safe, but most others not protected by licensing, etc., are at risk. Even those will skills in IT are getting strong competition from India and other technologically advanced counties with a lower wage.
ReplyDeleteThis is resulting in two things, first, fewer industrial jobs and lower wages for workers faced with global competition. This has structural implications for employment in that displaced workers must find substitutes, which is not always easy since industrial capital is flowing abroad and financial capital increasing in the US.
Displaced workers that find jobs often also find themselves underemployed — either over-qualified, employed out of their knowledge or skill area, or paid less than previously. It's not just a question of quantity of jobs but also quality.
Many people that would have retired or would be planning to retire soon are changing plans due to retirement savings being reduced owing to the effect of the crisis on housing and financial investment. Consequently, unemployment and underemployment is high among younger workers, especially those entering the workforce. Businesses are not creating jobs fast enough to absorb population growth, especially when older workers are choosing to work longer. Subtracting government job creation, US job creation has been dismal for some time.
There are also transitional problems owing to the housing crisis. Workers that would ordinarily relocate if a job were available cannot do so now, because they are underwater and locked in, or cannot sell easily in this market without taking a significant hit to equity.
While these are all problems that need to be faced. it still seems to me that lagging demand is the chief factor to deal with right now, with unemployment and underemployment historically high. As long as we are in a balance sheet recession and the Triffin Dillemma holds, then budgetary deficits will be required. Instead, the Obama administration, faced with an congress intractable on more stimulus, proposes to double exports in two years, which seems unlikely. However, the tax deal may provide the budgetary deficit as long as expenditure is not reduced.
But along with this is the structural transition taking place due to globalization, financialization, and technological innovation. This would be happening without the crisis, and it would still be a major socio-economic factor in the US. Overall globalization is a good thing, but it is causing dislocations, and employment effects in developed countries is one of them.
Nick: I think you are likely the only person here who gets what I am saying here. I like your interpretation. And, indeed, your prediction that the UE+NE flow falls is correct (see my addendum).
ReplyDeleteAndy: I like your story too. Nevertheless, I still think (though I am not sure) that it would be difficult to square (say) the rise in the NU flow with deficient demand. If firms are not hiring, nonparticipants are unlikely to start looking for work.
Rortybomb: Thank you for the links to the data. Yes, I agree that in general, rates are to be preferred over levels. I just don't think that this is one of those cases.
Tom Hickey: Well said, thank you. Not bad for a non-economist. Not bad at all. ;)
Congrats on your honorable mention by Krugman. Your blog stats must be dancing.
ReplyDeleteYour Q: ...there are more U finding employment. I am asking how this is possible if there are no jobs available, as is commonly asserted.
re: Graph #1 -- However, look at what happens to the UE flow. While it does not rise as sharply as the EU flow, it rises nevertheless...and continues to remain high even as the EU flow declines. Is this surge in job finding rates among the unemployed consistent with the deficient demand hypothesis?
Perhaps if the blue line factored-in the declines in rates-of-pay, it would show less increase and be more consistent with that hypothesis. (I offer no evidence of declines in pay, but we *are* just hypothesizing, here.) ...as Nick Rowe puts it: "Maybe high quality workers losing their jobs, and getting re-hired at worse ones?"
re: Graph #2 -- But again, the surge in discouraged workers appears to be more than offset by a surge in "encouraged workers." How is this consistent with the deficient demand hypothesis?
And in your later comment: If firms are not hiring, nonparticipants are unlikely to start looking for work. That, I doubt.
People do have to eat. We're not only statistics. Perhaps there are psychological changes caused by the recession, which drive more people to look for work, out of N and into U. (Hypothesizing again.)
The NU flow is the complement of the NE flow. If demand is high and you decide to get a job, you just get one (NE). If demand is low and you decide to get a job, you start looking (NU). I'm pretty sure NU+NE is lower during recessions.
ReplyDeleteDavid,
ReplyDeleteWhere would people who continue to claim unemployment status but work part-time or on a contract basis show up?
I wonder that nobody said this but it occurs to me that the move from N to U is because spouses of those moving from U to E will start looking for a job as well.
ReplyDeleteAs Arthurian said
"If firms are not hiring, nonparticipants are unlikely to start looking for work. That, I doubt.
People do have to eat."
To those who are questioning whether it is a problem with deficient demand or some supply side problem, if there were clear, undeniable evidence that deficient demand were the prime cause would you then support a direct jobs creation program that simply put money in the hands of people? Even with that evidence would you still insist that the govt cant create jobs, that we need to induce the private sector to hire somehow by removing regulatory impediments (pretty much the tack we are taking right now),lower taxes and provide training?
ReplyDeleteIs there any situation under which you could support a directed, govt financed (by money printing no debt issuance) jobs program designed to allow people access to a salary and participate as consumers again?
David, I miss your puzzle. Any labor market search model with endogenous destruction seems to predict this pattern. If the surplus of the match gets lower through an aggregate shock, more workers are destrcuted and unemployed, vacancy posting falls but to a smaller extend, liklihood of finding a worker moves up for a given vacancy, job-finding rates fall, but meeting more unemployed, so UE flows raise, you get a positive co-movement between vacancies and unemployed, Shimer 2005 was puzzled about it and used it to argue that destruction rates are constant (he is still confused) typically you restore the beveridge curve by search on the job using EE-rate (ramey 2008), but for a large shock of destruction this is not true
ReplyDeleteYour basic claim on deficient demand: in the standard model the shock is TFP, but any demand shock story lowering the surplus of the match would deliver identical results, so I don't see how your plots shed any light on demand vs. supply shocks as long as demand reduces the surplus of a match (of course you are fully right that it is re-allocation, there are no demand shocks, but that is not the fun of the argument I guess)
David,
ReplyDeleteWouldn't you say that the Employment to Nonemployment Transitions graph is entirely consistent with the demand deficiency theory?
The rise in UN is curious but seems to be explained by the increase in folks moving from nonparticipation to unemployment. Why were people running into a collapsing labor market? We've heard a couple of viable stories in your comments that are consistent with the demand deficiency view. What stories would refute that view?
Oops
ReplyDeleteThat should read
"I wonder that nobody said this but it occurs to me that the move from N to U is because spouses of those moving from E to U will start looking for a job as well."
Minor quibble:
ReplyDeleteIsn't vertical scale thousand, not million?
The Arthurian: Thanks; although a colleague of mine asked whether I have heard of Icarus.
ReplyDeleteAndy Harless: According to my calculations, the NU+NE flow rose during the recession (I can send you the data).
Prof J: You are counted as employed by the LFS if you report doing any paid work in the previous 4 weeks.
Reason: That's a good point, and it's not inconsistent with the reallocation story.
Anonymous: You are the only one to recognize that my query/critique holds equally for those who like to emphasize TFP shocks. As for not seeing my puzzle, try extending your model to a three-state model (employment, unemployment, and nonpartipation). Are you convinved that a basic TFP/demand shock is all you need to replicate the cyclical patterns of all these flows? (I'd be interested in seeing that model--maybe it already exists).
Peter Huffaker: Yes, I would say that the EN transitions graph is consistent with the DD hypothesis. But that was not my question. I was simply interested in asking people how they would go about squaring DD with the facts I reported above. I received some pretty good answers.
himaginary: My goodness...you are correct! Sorry about that.
"...and it's not inconsistent with the reallocation story. "
ReplyDeleteAnd also not with the AD story. So it isn't evidence anymore for the reallocation story. Basically the story is : if the "breadearner" has a reduced probability of finding a job, then supportive spouse needs also to try to find a job. The family has to eat.
reason:
ReplyDeleteI see. So the observation is consistent with both interpretations. Which means it's no longer evidence for one interpretation?
You are being unreasonable.
OK, how 'bout this: During good times, demand is high in all labor markets. During a recession, demand is high in some labor markets but low in others. Assume agents know whether we're in a recession but don't get information about their specific labor market until they look for a job. In that case, when we are in a recession, an NU transition is rewarded with information about the state of ones own labor market. When we're in good times, it is not rewarded with that information, because one already has that information (because demand is high in all markets, so it must be high in ones own). Therefore, there is an incentive to do NU transitions during recessions.
ReplyDeleteAlternatively (or complementarily) suppose agents know when a recession starts but not when it ends. During a recession, there is an incentive to keep doing NU and UN transitions, in order to repeatedly check whether the recession is over. Once you've done an NU transition and gotten the information that the recession is still going on, there is little reason to keep looking, so you do a UN transition. Then you wait long enough that the recession might have ended, and you do another NU transition. Repeat until recessions ends.
Andy:
ReplyDeleteYeah, this sounds interesting. We'll have to revisit some of your assumptions. For example, demand is not high in all labor markets in a boom (manufacturing, information services, for example, are in secular decline). But just details that may not matter.
The point is (I hope I am not putting words in your mouth) that recessions are disruptive--they shuffle all sorts of things around--and the returns to information gathering may be high. I like this idea because, as U is defined as "active job search," I like to think of U as an information-gathering activity (relative to N, which is more passive). It may make sense to poke your head out of the rubble once in a while to see whether its safe to come out. And so, this could, in principle, account for large increases in (for example) the NU and UN flows even as aggregate demand remains depressed. Something like this, anyway.
hey David,nice post. I love the style of blogging I see here :)
ReplyDeleteyou see, there are 2 blogs that i've found so far to be very helpful and have something interesting for me whenever i visit, this one and http://danieluyi.com
Keep it up. I will be visiting again.