On October 9, 2010, I posted some regional vacancy-unemployment data for the United States; see: Beveridge Curves for 36 U.S. Cities.
My measure of vacancies was the Conference Board's help-wanted index (HWI). A colleague of mine (Silvio Contessi) pointed me to a paper by Regis Barnichon (EL 2010) that identifies a major flaw in this data series. Barnichon summarizes the problem here:

That is, the secular decline (blue line) in the original HWI series is estimated to be entirely the consequence of a substitution away from print to electronic forms of job advertising.
With this in mind, I asked my tireless research assistant (Constanza Liborio) to recalculate our regional Beveridge curves using Barnichon's correction (for those interested, I can email you a file describing the exact procedure employed).
The regional vacancy data was purchased from the Conference Board (their Help Wanted Online data series), so unfortunately, I cannot make it available to you without their permission. I have permission to display the data, however. Here is what we get.


Addendum: Dec. 13, 2011My measure of vacancies was the Conference Board's help-wanted index (HWI). A colleague of mine (Silvio Contessi) pointed me to a paper by Regis Barnichon (EL 2010) that identifies a major flaw in this data series. Barnichon summarizes the problem here:
Here is how Barnichon's correction looks for the aggregate data.The traditional measure of vacancy posting is the Conference Board Help-Wanted Index (HWI) that measures the number of help-wanted advertisements in 51 major newspapers. However, since the mid-1990s, this “print” measure of vacancy posting has become increasingly unrepresentative as advertising over the internet has become more prevalent. Instead, economists increasingly rely on the Job Openings and Labor Turnover Survey (JOLTS) measure of job openings. However, this measure is only available since December 2000 and cannot be used to contrast current labor market situations with past experiences.In this paper, I build a vacancy posting index that captures the behavior of total—“print” and “online”—help-wanted advertising, by combining the print HWI with the online Help-Wanted Index published by the Conference Board since 2005.
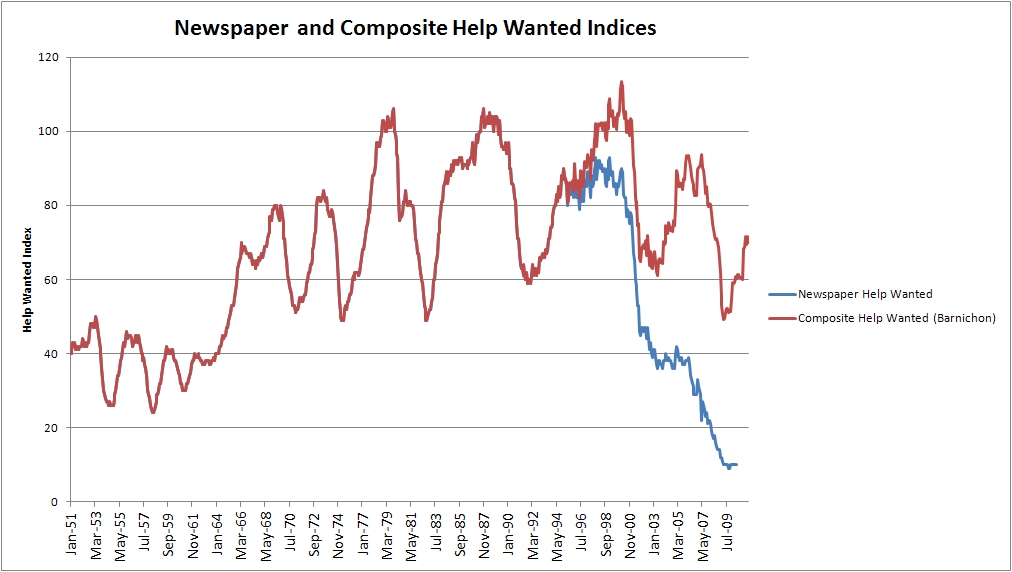
That is, the secular decline (blue line) in the original HWI series is estimated to be entirely the consequence of a substitution away from print to electronic forms of job advertising.
The regional vacancy data was purchased from the Conference Board (their Help Wanted Online data series), so unfortunately, I cannot make it available to you without their permission. I have permission to display the data, however. Here is what we get.


As I have stressed in an earlier post, one should be careful in using these raw correlations to identify the source of disturbance; see: Interpreting the Beveridge Curve.
A reader points out that the Monster Employment Index (available since 2004) might be of some use for measuring regional employment opportunities.
Neat! The take-away I get, from eyeballing those pictures, is that there has been no obvious shift in the Beveridge Curve recently. (Maybe in some cities it has shifted in, and in other cities it has shifted out.) Therefore it's (mostly) AD.
ReplyDeleteIs that what your eyes see, or are my eyes biased?
Great post.
ReplyDeleteNo evidence of "structural" unemployment in the majority of cities.
Those who oppose fiscal stimulus and argue against weak aggregate demand as the cause of for high unemployment will keep throwing out canards and it will take decades to rebut them one at a time.
bakho
Nick, I agree that once the correction is applied, the resulting BCs take on their more classic shape. A lot of interesting regional variation too. What one concludes from just these correlations, however, is a different matter. I prefer to interpret them through the lens of different models. The curves do appear to be consistent with "demand" stories of the cycle. But they may be consistent with other interpretations as well.
ReplyDeleteAs a former professional Economist, now owner of a small business, I can confirm that newspaper advertising is dead. I stopped paying for newspaper adverts years ago, when I found that a free ad on Craigslist produced over 100 replies on the first day.
ReplyDeleteHowever recently I have not had to advertise at all - as jobs grew scarcer, I have been able to fill vacancies from job seekers who cold call, or just email me their resumes. Yet here in Austin we have relatively low unemployment rate. (might be interesting to see your curve for Austin too).
Perhaps you should consider some measure of new hires? Here in Texas all new hires have to be reported to the AG Child Support division (so they can ask us to garnish wages). Also quarterly we have to report wages for all staff by SS# to the Texas Workforce Commission for Unemployment Tax. Since they have to add wages to previous wages from that employer for the year, they should be able to calculate number of new hires each quarter by SIC. They also ask for total number of staff on payroll for each month of the quarter.
Paul
It looks clear to me that a lot of the Midwest has a sharply shifted Beveridge curve. Just look at Oklahoma... and this place is loaded with shale gas. I bet this could reflect a change in the financing constraints for those states with capital intensive baby-industries (a lot of other capital intensive industries already have their capital!). They want to hire, but simply cannot finance the equipment necessary to make hiring profitable. Or perhaps its skill mismatch at the city level... like the good guys at the NY Fed (Sahin, Violante, et al) have found important industry mismatch components. These pictures are consistent with that hypothesis and provide even better evidence since this is at a city level over a longer period of time (the NY Fed guys look at post 2005 HWI data at state and census regions).
ReplyDeleteKyle
@Nick Rowe, @backho:
ReplyDeleteIf it is aggregate demand, you must be more specific... its certainly not from the consumption side (real consumption is several percent *above* trend). If it is coming from the business side, the question is why? I think it is due to these big skill mismatches in the Midwest, high business tax rates, and the aftermath of a construction meltdown on the coasts (and whatever this translates into via the input-output matrix... i.e. Juan Sanchez's work posted in David's blog a while back).
Here are the aggregates, taken from Kahn and Thomas' recent paper on credit shocks (I croped it and put it somewhere easy to access), Image of Aggregates
I used to think I knew what people meant by AD. Perhaps I could prevail upon Prof. Rowe and/or David to explain it again? I used to think that AD meant 'total expenditure' or some such. Surely I've oversimplified the story, so I ask most humbly for a conceptual explanation of AD, or indication of a good source.
ReplyDeleteThank you.