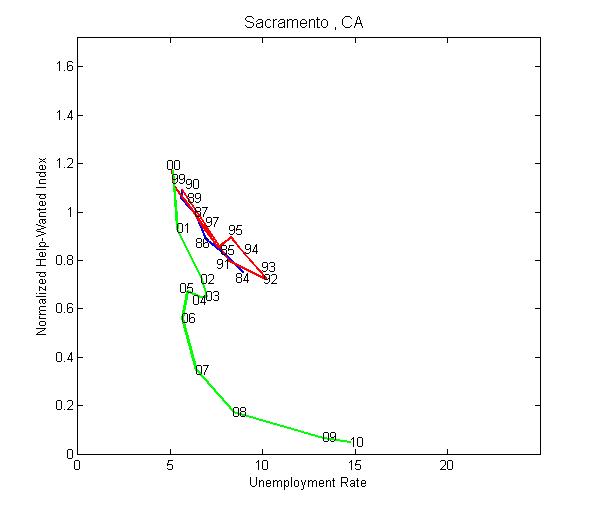
The following charts were constructed by Constanza Liborio (my faithful RA). To ease cross-city comparisons, all charts are of exactly the same dimension. The help wanted index (HWI) is from the Conference Board Help Wanted Index (1987=100). Constanza divided the city-level HWI by city-level employment, and then normalized 1987=1. The city-level unemployment rate data is from the BLS.
We have data for most cities ranging from 1984-2009 (some include 2010). The 1980s are colored purple; the 1990s are colored red; and the 2000s are colored green. (You should be able to enlarge the diagrams by clicking on them).
One thing that struck me was how steeply sloped the "long run" Beveridge curve appears to be across many cities. Or, if you're one who likes to imagine relatively flat BCs shifting over time (a la here: A Classroom Lesson: The Phillips Curve), then this evidence appears to suggest that something "structural" has been in play since the mid 1980s. Take a look, for example, at Cleveland and Miami. The unemployment rates in those cities are now about the same as they were in the mid 1980s and mid 1990s; even though recruiting intensity has dropped to the floor.
And take a look at poor Detroit. Here, one is tempted to say that low recruiting intensity is responsible for high unemployment (the classic BC statement). But as Cleveland and other cities demonstrate, unemployment can be high for reasons that appear independent of recruiting intensity.
Please feel free to share your impressions of this data.


Important material. I looked for something along these lines a few weeks back while trying to better understand the subtle differences between structural and cyclical unemployment but... there doesn't seem to be much around that isn't based on sectors and on a national basis. After giving some thought to this issue, and after a considerable amount of reading, I came up with this humorous bit:
ReplyDeleteA few months back, a spaceship hid behind the moon for about 2 months. Turns out, its inhabitants, a grimy and disgusting lot, needed some cleaning done on their ship. So, they beamed-up all of the janitors from Cleveland, Ohio, a place well-known of course for cleanliness in difficult conditions.
At the time none of the many economists in the US even noticed that these janitors were missing, it seems they were only paying attention to the national data bases and only by sector based analysis. But of course janitors work in all sectors so the economists still don't know about this. It is in fact possible that I am the only person to have noticed this phenomena outside of Cleveland, and the people there are all too busy cleaning up after themselves to do much else, naturally.
Next time they come for some cleaning service, we should offer up our economists.
Present company excluded of course.
Anyway... this structural/cyclical issue seems in need of more attention. There is a study that appears to have an interesting methodology, similar to yours, but in regards to underemployment, it is here:
http://www.chmuraecon.com/underempl/
(impressive site) Ray L-Love
David,
ReplyDeleteI think the original HWI index tracked advertisements printed in major newspapers. I would think that over time this made it less and less representative of actual job openings (with internet, AEA-JOE and all that). Perhaps that helps explain the seemingly structural change.
SContessi: That's a good point. But do you for sure that the HWI never expanded its scope beyond print newspapers over the years? If it did not, then this would explain a lot.
ReplyDeleteI live near Killeen/Ft. Hood in Central Texas. This area has no shortage of jobs, relatively speaking. The classifieds throughout central Texas list a long and varied assortment of low-paying jobs.
ReplyDeleteHowever, by example, I know journeyman carpenters who are unable to find jobs at half of their previous wages in capacities ranging from janitorial to maintenance etc. What little work that is available to construction workers in this area is being done by Hispanic crews, mostly by contract. These crews do not consist of undocumented workers exclusively, but fluent Spanish is a must and racially mixed crews are rare.
I live in a rural area where it is made obvious that the competition with undocumented workers intensifies as the distance increases outwardly from metropolitan areas. The diversity regarding job types also expands into occupations that are essentially the entire spectrum of jobs that do not require some form of documentation. For instance, undocumented immigrants have small businesses doing auto/tractor repair, pool care services, fence building and on-sight welding operations etc. Put simply, undocumented immigrants are not just workers anymore, they have a wide range of skills and they offer those skills at a price level that is below what citizens are able to compete with due to the significant differences in overhead costs etc. And, undocumented immigrants have become entrepreneurial in all of the ways open to bidding for work, by commission etc., but mostly as subcontractors in competition with each-other more than with legal businesses.
As the joke goes here in Texas: When Davy Crockett looked out over the wall at the Alamo, and saw Mexicans as far as the eye could see, he said, "I didn't know that we were pouring concrete today".
Using the standard of hysteresis, illegal immigration causes structural unemployment as wages fall to levels below what citizens are able to work for.
Plus, I should probably add, if the welfare of the immigrants is truly a concern, that concern should lead to an effort that begins with phasing out ag subsidies. That effort would do more good for a much larger number of people, who need and deserve help, than what is happening now.
Ray L-Love
I will promote afriend's research then ;)
ReplyDeleteBarnichon (2010). Building a composite Help-Wanted Index, Forthcoming in Economics Letters
doi:10.1016/j.econlet.2010.08.029
Composite = online+print
Perhaps this can be done at the city level...?
ciao
SContessi: Thanks. For those who might be interested, Barnichon's website is: http://sites.google.com/site/regisbarnichon/research
ReplyDeleteR L Love: Your story reminds me of when I lost my construction sector job in the 1981 recession (in Vancouver). Interesting stuff...thanks.
this is quite interesting.
ReplyDeleterob shimer used the aggregate HWI in his AER paper. (JOLTS barely existed back then.)
he noted that there was some long-run trend (esp the recent period) because of changes in newspapers. this would be even more of a concern at the local level (local newspapers disappearing?)
shimer dealt with that by removing a slow moving hp filter. perhaps you can do the same?
alternatively, your RA could use JOLTS data which is available at industry or "region" (NE,NW, etc.) level?
as basically a metal bashing town, cleveland's situation actually started deteriorating in the 60's...from a peak population of near a million, its down to around 435K, and all the counties in northeast ohio have declining populations due to outmigration too...once the home to the #3 and #4 US steel companies, the top employer is now the cleveland clinic...
ReplyDeleteAnonymous: Yeah, I have that JOLTS regional data and will post it soon. Will also send away for the conference board's online HWI data and see whether this makes a difference.
ReplyDeleterjs: I've spent a lot of time in Cleveland over the past 10 years and it ain't getting any prettier. It's bad when the downtown coffee houses have to close on the weekends for a lack of people.
David,
ReplyDeleteWith all the doom and gloom, I thought you might enjoy some Hallowe'en hilarity:
http://www.independent.org/blog/index.php?p=8212
There has to be some kind of data issue.
ReplyDeleteTake Cleveland for example. The index almost declines steadily throughout the last decade. Did the economy of Cleveland constantly shrink throughout the last decade?
not to beat a dead horse, westslope, but cleveland's economy has been constantly shrinking for 50 years...
ReplyDelete1960 876,050 −4.2%
1970 750,903 −14.3%
1980 573,822 −23.6%
1990 505,616 −11.9%
2000 478,403 −5.4%
Est. 2009 431,639 −9.8%
http://en.wikipedia.org/wiki/Cleveland