Believe those who are seeking the truth. Doubt those who find it. Andre Gide

Wednesday, December 22, 2010

The Great Canadian Slump: Can it Happen in the U.S.?

The large decline in U.S. employment has had me reminiscing about Canada's similar experience in the early 1990s. I remember Pierre Fortin's presidential address to the Canadian Economic Association in 1996, entitled The Great Canadian Slump. Fortin seems to place much of the blame for this episode on the Bank of Canada; a claim hotly contested by Chuck Freedman and Tiff Maclem of the BoC here. I see that Stephen Gordon of WCI was reflecting on this episode in Canadian economic history as well; see here.

Let's begin by looking at employment-population (E/P) ratios. Population for Canada is 15+; for the U.S., it is 16+ civilian, noninstitutional (sample period 1976:1 - 2010:3).


The two series are similar up until about 1990. Then the recession hit. And it hit much harder and longer for Canada.

In 1990, E/P dropped by less than 2 percentage points in the U.S.; and dropped by about 4 percentage points in Canada. Now take a look at 2008; it is exactly the opposite. Canadians, apparently, don't need a world financial crisis to generate crisis-like employment slumps. In fact, the financial crisis appears to have had relatively little impact on Canada (that is, relative to the U.S., and relative to Canada in 1990).

One thing that might be of interest (or concern) for Americans is the length of Canada's employment slump. The E/P ratio essentially flat lined for about 5 or 6 years; and did not attain its pre-recession peak of 62% until well into the next decade.

Let me normalize real per capita GDP and the E/P ratio each to 100 in 1990:1. Here is what Canada's output and employment history looks like for the 1990s:


Now, that's what I call a jobless recovery!

It's interesting to look at other measures of labor market activity too. The next graph shows the participation rates (labor force divided by adult population):


Part rates are similar until 1990, and then exhibit almost a mirror image. Note that the U.S. participation rate shows some evidence of secular decline since reaching its peak. The next graph plots unemployment rates (unemployment divided by labor force):


The large gap in cross-country unemployment rates that emerged in the early 1980s and persisted for two decades elicited a fair amount of hand-wringing and a collective gnashing-of-teeth in Canada. To see what people were talking about, have a look here.

The main point I want to convey here for Americans is that the prospect of a prolonged jobless recovery, with persistently high unemployment rates, is not outside the realm of possibility. Such an episode has occurred in the recent past and, moreover, it occurred in an economy that is more similar to the U.S. than perhaps any other (in particular, Canada is not Japan).

This does not, of course, mean that a jobless recovery is inevitable. But I do think it might be worth exploring what parallels (if any) exist between these two episodes, and to see what might be learned from it. Will keep you posted, but in the meantime, feel free to share your thoughts.

Saturday, December 18, 2010

Interpreting the Beveridge Curve

The Beveridge curve (BC) refers to the relationship between job vacancies and unemployment. There are really two types of BCs: one empirical, and one theoretical. The empirical BC is simply a scatterplot of vacancy and unemployment data. Think of data as the entrails of a gutted animal. The theoretical BC is an interpretation of those entrails, as divined by an economic haruspex.

The empirical BC is usually negatively sloped. Except for when it isn't. (You know how it is.)

The theoretical BC is a very intuitive creature. If some measure of general business conditions improve, especially in terms of economic outlook, businesses will generally want to expand their investments. And this includes investment in the form of replenishments to their labor force. If the labor market is subject to search frictions, the hiring process will take time. But an increase in job openings will generally make it easier for unemployed workers to find a job, so we would expect unemployment to decline as job vacancies rise.

Sometimes, however, the BC appears to "shift" its position (e.g., if the BC looks like a shotgun blast). These apparent shifts are sometimes interpreted to be the consequence of shocks that somehow lead to increased search frictions (let me label these "structural" shocks). In his fine Nobel prize lecture, Christopher Pissarides gave the example of Brittain 1975-84:


Usually though, the BC has a sharper negative slope. This was certainly the case in the United States; at least, until recently. Here is a plot of the U.S. BC using JOLTS data. Both job openings and unemployment are divided by a measure of population (16+ civilian). The dots represent the empirical BC and the solid line represents a theoretical BC.


A fairly conventional interpretation of the pattern above is that the U.S. experienced a cyclically-induced increase in unemployment; at least, approximately up until the recession was formally declared ended. These are the blue dots (lying close to that BC line I am forcing into your brain). Since then, something screwy appears to have happened in the labor market. There is evidence of increased recruiting activity, but no evidence of declining unemployment (the red dots).

Is this evidence of some greater difficulty in matching unemployed workers to available jobs? Did the recent recession leave us with some "structural" problems? If so, can we identify precisely what these "structural" problems are, and what--if anything--might be done about it? These are just some of the questions people are asking theses days.

Unfortunately, I'm not presently able to answer these questions. What I offer, instead, is some speculation on another question that has been floating in my mind lately. In particular, is the pattern of the U.S. BC plotted necessarily inconsistent with the notion that "structural" shocks have afflicted the labor market throughout the recent recession?

It was Steve Williamson's blog post here that got me thinking about this. Underlying much of the modern theory of search in the labor market is the Phelps/Pissarides aggregate matching technology:

[1] ht = xtM(vt,ut)

where h denotes hires, v denotes job openings (vacancies), and u denotes unemployment. For quantitative applications, M(.) is usually specified to be Cobb-Douglas; e.g., M(v,u) = v0.5u0.5. The x parameter corresponds to the TFP parameter in a standard aggregate production function. Following Steve, I use the JOLTS data to compute the matching function "Solow residual:"

[2] log(xt) = log(ht) - 0.5log(vt) - 0.5log(ut)

And here is what I get:


The red dots depict TFP from December 2007 (the official start of the recession) onward to October 2010.

According to the plot above, events beginning with the recession have reduced matching function efficiency by about 20%. That's a big drop. But what does it mean? It's important not to get too carried away with this result. In particular, we have all the usual measurement problems to contend with when constructing TFP measures. For example, much or perhaps even most of the decline in measured TFP may be the consequence of (unmeasured) reductions in search intensity.

On the other hand, there does not appear to be any good reason to simply dismiss the result as evidence of increased search frictions. We just lived through an episode that tore apart many ongoing relationships. Picking up the pieces and putting them back together again (possibly in new and more productive ways--re: Schumpeter's creative destruction) may be a bit more difficult this time around. Ultimately, I think we will need to examine the microdata to assess the "disruptiveness" of the recession. Perhaps a study along the lines of Rogerson and Loungani (JME 1989)--who look at PSID data--might shed some light on the matter.

But until then, if we take the measured TFP data seriously (and, again, I emphasize the caveats), might this warrant reinterpreting the U.S. BC in the following way?


The red dots represent the empirical BC since the beginning of the recession (Dec 2007); the time when the estimated matching function TFP appears to weaken.

It is interesting, I think, to examine this interpretation in the light of a simple labor market search model. In an earlier post, I argued that a negatively sloped BC is not inconsistent with a sequence of shocks that deteriorate matching efficiency; see here. Let me show you what I mean, via a simple example (that restricts attention to steady-states).

There is a cyclical variable, labeled y. This denotes the output produced by a job-worker pair. I assume a "fair share" bargaining rule that divides this output into wage and profit components. A firm's flow profit is given by the share ξy. The present value of this profit flow is denoted J(y). This value is procyclical; i.e., it will increase when the cyclical variable y increases.

If a firm wants to open a job vacancy, it must bear a cost κ. It is successful in finding an unemployed worker with probability xq(θ); where θ = v/u is the "labor market tightness" variable, and where q(.)=M(.)/v. If the new hire starts work next period, the expected present value of posting a vacancy is xq(θ)βJ(y). The following zero-profit condition determines the equilibrium labor market tightness:

[3] xq(θ)βJ(y) = κ

Condition [3] determines θ(y,x). It is easy to show that θ is increasing in the "cyclical" variable y and the "structural" variable x.

Finally, there is a stock-flow equation that determines the equilibrium unemployment rate: u = σ / (σ + xp(θ)); where σ is an exogenous match separation parameter (job destruction rate).

I parameterize this simple model and compute the equilibrium vacancy-unemployment combinations under two scenarios (GAUSS code available on request). First, I vary the "cyclical" variable y 15% above and below its mean value, holding x fixed. Then, I hold y fixed at its mean value and vary the "structural" variable x 15% above and below its mean. And here is what I get:


What is interesting here is that a permanent decrease in the match efficiency parameter x leads to a permanent decline in job creation and permanent increase in unemployment (of course, I am not suggesting that these "structural" shocks are in any way permanent in reality). I think it was Abraham and Katz (JPE 1986) who led many (including myself) to believe that structural changes should lead to a positively-sloped BC. Of course, they did  not have an explicit model. According to this simple model, they appear to be wrong. We may at least conclude that they are not necessarily correct.

In short, one reason why job openings may have declined is because it is generally more difficult for firms to find the right worker. Indeed, given how circumstances may have changed since the recession, firms may not--as of yet--even know what type of skill set constitutes the best hiring investment. Until this uncertainty in the match-making process sorts itself out, it may make sense to recruit less intensively.

Monday, December 13, 2010

Deficient Demand: The Deflated Balloon Hypothesis

It ain't what you don't know that gets you into trouble. It's what you know for sure that just ain't so. Mark Twain.

At one level, it is easy to understand the popularity of the deficient demand hypothesis. First off, it's pretty much the first thing any undergrad learns in the way of macro theory. Second, they tend to learn it as a factual and self-evident explanation of the way the economy actually operates; not as an hypothesis or interpretation of the way an economy may work. Third, it is apparently easy to "see" evidence of deficient demand out there (much in the same way people can "see" the Phillips curve here?). They can "see," for example, that many firms cite a lack of product demand as a reason for holding back on making commitments to future capacity (including the addition of fulltime workers). The flip side of deficient demand is a "savings glut." People claim to see this as well; for example, in the form of low inflation and low Treasury yields. 

Well, heck...I can see these things too. But the question, surely, is not what we record in our measurements. The question is how these measurements are to be interpreted. Interpretation (or explanation) necessarily entails a theory. (I define theory as a set of assumptions leading to a set of conclusions through the use of deductive logic.) And it is frequently the case that a given phenomenon has more than one plausible (or no less plausible) interpretation.

Before I go on, I want to make something clear. I do not disapprove of the practice of asking people what motivates their behavior. I would, in fact, like to see more in the way of this type of field work; see here. Having said this, we need to be careful in interpreting any given survey response as supporting one or some other theory. This is especially true in macroeconomics, where general equilibrium (system wide feedback effects) are likely to be important. According to Krugman, this is what makes macroeconomics hard.

And he is right. Unlike partial equilibrium analysis, it is conceptually difficult to identify independent "supply" and "demand" schedules in a dynamic general equilibrium system--everything is interelated, after all. Consider, for example, a shock that contracts the supply of some object (oil, credit, etc.). The ensuing price rise may lead oil-intensive sectors to curtail not only their demand for oil, but also their demand for a variety of complementary intermediate inputs. To the suppliers of these inputs, this will look very much like a "lack of demand" for their products. They are obviously not wrong for saying this. But upon hearing such reports, it would be rather hasty to conclude that these reports necessarily imply that "aggregate demand is too low."

With that out of the way, let me now discuss the deficient demand hypothesis. Some people may have been led to think that I don't believe that there is a demand problem. That's not quite true. It seems clear enough to me that the aggregate demand for investment (broadly defined to include investment in recruiting activities) is depressed. I'm just not very sure of the source of this depression. Understanding what these "fundamentals" are is necessary, I think, if we want to identify an appropriate policy response (more generally, the properties of an optimal policy rule).

Let me try to formalize what I mean here by way of a simple model that is, I think, sufficiently flexible to accommodate a range of views. I describe the model in some detail here (it is an OLG model). The fundamental economic friction is limited commitment, leading to an asset shortage; see here. The asset shortage gives rise to role for government debt (or money). The model highlights a portfolio choice problem: people must decide how to allocate a given amount of savings between two available asset classes, money and capital.

The key parameter in the model is the expected return to capital investment. A shock that depresses this expectation leads wealth-maximizing agents to substitute out of capital and into money. There is a collapse in aggregate investment spending (leading to a decline in future GDP); and there is a corresponding "flight" into government securities (money). For a fixed stock of money, the price-level drops (reflecting the increase in the market value of money); that is, the shock is deflationary. In short, the model generates something that resembles what we experienced in the recent recession.

Now, let's imagine that these expectations remain stubbornly depressed. What are the policy implications? Would it help if I told you that this is a model where increasing government spending (on investment), or lowering the interest rate (on government securities), or increasing the inflation rate, all serve to stimulate real economic activity? (This is, in fact, a property of the model.) It's tempting, isn't it? The economy is depressed and you have the tools to "fix" it. But hold on a minute. Before proceeding with your government stimulus plan, shouldn't you first ask why expectations appear to be so stubbornly depressed?

At the risk of oversimplifying, imagine that there are two possible answers to this question. [1] agents are rationally pessimistic; they forecast low returns on their investments because the environment (including the likely evolution of future government policies) dictate such a view. [2] agents are irrationally pessimistic; they forecast low returns on their investments for psychological reasons (e.g., Keynes' animal spirits). 

Under interpretation [1], the decline in investment and flight to money is a rational response to an unfortunate  event that has altered the economic landscape. One might imagine a rather muted enthusiasm for government stimulus under this interpretation. Under interpretation [2], the depression is caused by a collectively irrational flight to government bonds (Brad DeLong) or money (Nick Rowe); see their debate here. Under this interpretation--which is what I think most people have in mind when they speak of deficient demand--there is a strong case to be made for government intervention. There is obviously room here for reasonable people to disagree.

I want to conclude now with what I think is a shortcoming of the deficient demand hypothesis. It seems to me that the hypothesis leads us to think of a recession the way we might view a deflated balloon. The fundamental structure of the balloon remains intact, even if it is deflated. All that is needed to get back things to normal is a puff of fresh air. And if the private sector seems unwilling or unable to blow, then let the government do it instead. What could be simpler and more obvious?

My own observations over the years have led me to view recessionary events more like Humpty Dumpty after his great fall. Hands up all of you who think that the financial crisis had a severe impact on the economy's "structure." What do I have in mind here? Think about the disruptions that must have occurred in the form of terminated relationships (firm/worker, creditor/debtor, supplier/retailer, etc.). Think about the disruptions created out of a growing realization that resources have been misallocated (i.e., investments that looked good ex ante, now look like a bad idea ex post).

The main point is that a crisis destroys capital, broadly defined to include relationship capital--the glue that keeps the structure of economic relationships intact and productive. Sure, a breach in this structure may lead to deflated expectations and deficient-demand-like phenomena. But do not confuse symptoms with causes. The process of reallocating resources and rebuidling relationships after a traumatic event like the recent financial crisis is likely to take some time. This would be true even if all the king's men knew how to put Humpty Dumpty back together again.

Friday, December 10, 2010

Is the Deficient Demand Hypothesis Consistent with the Facts on Labor Market Turnover?

What's holding back the U.S. labor market? Why does employment growth remain slow? Why does the unemployment rate remain so persistently high? Is a prolonged jobless recovery possible? These questions are naturally at the forefront of current policy debates.

Some economists believe--were trained to believe, I would say--that the lacklustre performance of the labor market is easy to explain: there is a lack of demand. Just ask firms why they're not hiring: a lack of product demand frequently tops the list reasons provided.

I'm not sure that economists can rely on answers like this to identify the type of aggregate shock that is afflicting the economy. Think about the original multisector real business cycle model of Long and Plosser (JPE 1983). A negative productivity shock to one sector in their model economy could lead to a decline in the production and employment in many sectors of the economy. This is because firm level production functions use the intermediate goods of many sectors as inputs into their own production processes. To an individual producer, it would appear as the demand for his product is declining. And he would be correct. This lack of demand, however, bears no relation to the concept of "deficient demand" in the Keynesian sense.

In any case, let us take this deficient demand hypothesis seriously for the moment. Then I want to ask how this hypothesis might be reconciled with the labor market data I present below.

The first diagram plots the average monthly flow of workers between employment and unemployment (all data is from the U.S. Current Population Survey). The red line plots the EU flow (the flow of workers who made a transition from employment to unemployment). Leading up to the recession (shaded area), we see that in a typical quarter, roughly 1,750,000 workers per month exited employment into unemployment.

The blue line plots the UE flow (the flow of workers who made a transition from unemployment to employment). Leading up to the recession, we see that in a typical quarter, roughly 2,000,000 workers per month exited unemployment into employment.

When the recession hits, there is a large upward spike in the EU flow, as one would expect (people losing their jobs and becoming unemployed). This part seems consistent with the deficient demand hypothesis. However, look at what happens to the UE flow. While it does not rise as sharply as the EU flow, it rises nevertheless...and continues to remain high even as the EU flow declines. Is this surge in job finding rates*(see update below) among the unemployed consistent with the deficient demand hypothesis?

Note: the y-axis on the graphs below should read "thousands," not "millions." (Thanks to himaginary).
 

The next diagram plots the transitions between unemployment and nonparticipation (not in the labor force). The blue line denotes the UN flow (the flow of workers from unemployment to nonparticipation) and the red line denotes the NU flow (the flow of workers from nonparticipation to unemployment).


As you can see, these monthly flows are huge. And as one might expect, the UN flow rises dramatically during the recession. These are "discouraged workers;" and the phenomenon seems consistent with the deficient demand hypothesis.

But again, the surge in discouraged workers appears to be more than offset by a surge in "encouraged workers." How is this consistent with the deficient demand hypothesis?

It seems to me that this sort of data appears to be more consistent with an increase in reallocative activities in the labor market, rather than deficient demand. But maybe not. And if not, then I am curious to know what sort of stories people might tell to square their pet hypothesis with the data above.

Addendum: 11 Dec 2010

Nick Rowe asks about the NE and EN flows during this period. Here is the data:

In the following diagram, I plot the transitions into and out of employment. To do this, I define nonemployment = unemployment + nonparticipation.


If anyone would like to see anything else plotted, just let me know.

Update: December 21, 2010

I have to admit to being puzzled by many of the responses I received on this post. And then I came across this comment on my post by Brad DeLong: Department of Huh? I suddenly see what appears to be confusing people; in particular, the claim I make above (starred) about the surge in job finding "rates." This statement definitely belongs in the Department of D'oh!

Let me explain what happened here. When looking at labor market data, I usually deflate all series by some population measure. And so, I construct objects that I call the employment rate, the unemployment rate, the job finding rate, and so on. Perhaps I should call them "ratios" instead of "rates." In any case, for the purpose of this blog post, I chose to post levels. There is clearly a surge in the UE flow. And of course, there is also a surge in the job finding "rate" when one defines this object as UE/P (the conventional definition of this rate is UE/U). Mea culpa for the confusion.

Having said this, my typo in no way detracts from the substantive question I raised: Are these (level) flows consistent with the deficient demand hypothesis?
 
The data shows a large increase in the EU (job losers) and UN (discouraged worker) flows. It seems easy to understand these flows in the context of a deficient demand story. What I was trying to get people to do, however, was to square this same story with the large increase in the UE (job finders) and NU (encouraged worker) flows. How does depressed demand, leading to reduced job openings, also encourage more workers to look for work? It's an interesting and legitimate question, I think. And the answer is not obvious.

I expressed a view that the phenomena in question might be difficult to square with a deficient demand story and invited readers to share their thoughts on the matter; i.e., perhaps I was missing something. I want to thank everyone who responded thoughtfully to the question I posed. 

Wednesday, December 8, 2010

Nominal Interest Rates and Inflation Expectations in the U.S.

The following two charts of courtesy of my St. Louis Fed colleague, Kevin Kliesen.

The first chart plots nominal yields on U.S. Treasuries since September 1 to the present. Seems like there has been a significant increase in nominal yields since QE2 was announced at the November 2-3 FOMC meeting. 5-year notes are up 63bp and 30-year notes are up 30bp.


Now, I know what some of you might be thinking. First, you might be thinking how it is possible that these yields are rising when QE2 was expressly designed to bring these rates down. Well, as Minneapolis Fed president Narayana Kocherlakota explains here, the idea was to lower the long-run real interest rate; i.e., the nominal interest rate net of expected inflation. For this to be true, the nominal rate increases above should be consistent with declines in the real interest rate; and to ascertain this, we need a measure of inflation expectations.

The following chart plots a market-based measure of inflation expectations (the so-called, TIPS spreads--cheesy tutorial available here).


What we see in the chart above is that since QE2 was announced, inflation expectations have moved up by less than the rise in nominal interest rates. What this means is that long-term real interest rates appear to have increased since QE2 was announced in early November. Interestingly, many of my banker friends tell me that this is good news (too much rum in the eggnog, no doubt).

How does one make sense out of all this? Well, here is one story. Evidently (so I am told), the desired impact of QE2 may have manifested itself largely in the period leading up to its official announcement. It is true that the market was widely expecting some sort of quantitative easing. And nominal rates did largely decline, or remain roughly stable, in between FOMC meetings. At the same time, inflation expectations started to rise significantly, having the desired effect of lowering long-term real interest rates. Fed types like to think that this action has stimulated the U.S. economy (certainly, the stock market does not appear to be complaining).

Since early November, nominal rates are climbing higher...with inflation expectations remaining more or less stable (well...some measures do appear to be creeping up). So long term real interest rates appear to be rising. And this, evidently, is a bullish signal, since long-run real rates largely reflect expectations of real growth in the future. Of course, whether the Fed's QE2 policies actually had anything to do with these higher future real rates is debatable. But in any case, it's something to mull over. Pass that eggnog!

Sunday, December 5, 2010

A Reply by George Selgin

Note: George intially replied in a series of comments to my earlier post. Not all of his comments appear to have made it, even though my email alerted me that they were indeed posted. (Prof J, this appears to have happened with one of your comments too -- there might be a bug in this system). In any case, I have pieced together George's reply in a separate post here (hopefully, I haven't missed anything). Enjoy! DA

============================================

David has kindly alerted me to his critique and invited me to reply. So here goes.

A 40-minute public lecture is, first of all, not the best means in which to cover all the issues related to such a sweeping proposition as one holding that we can do better than we have with the fed. In fact my lecture is just the barest-bone summary of a much more complete argument contained in my, Bill Lastrapes, and Larry White's working paper, "Has the Fed Been a Failure?" which is available online through both Cato and SSRN links. I urge David and his readers to have a look at that paper which addresses several of the issues he takes up in his comments here.

With particular respect to those comments, a few points. First, of course the Fed answers to Congress, and has its goals set by that body. But note: my paper isn't a critique of the goals themselves (though there are indeed cogent criticisms to be made of the dual mandate in particular). It merely asks whether the Fed has been successful in achieving these goals. I claim that it hasn't been.

Regarding the Fed's powers, it is a very serious mistake to assume, as David seems to do, that these are properly gauged by noting that it supplies but a small component of the total money stock, most of which consists of various sorts of bank deposits. In fact, by controlling the monetary base (which consists not only of the stock of paper currency, as David indicates, but also of the stock of bank reserves in the form of credits with the various Federal Reserve banks), the Fed operates a lever by which is is capable of regulating the total stock of money and the total flow of credit. Think of a government monopoly of shoes for left feet and consider the degree to which that monopoly would influence the total availability of shoes and you will begin to get the right picture.
 
Concerning the fact that the Fed adjusts the available stock of base money through open-market operations and discount window (or other kinds of) lending rather than by dropping stuff from helicopters, I'm sure I've never suggested otherwise and that none of my critical observations concerning the Fed's performance hinges on the helicopter-money assumption.

David asks whether the "political reality," consisting of the abuse of the Fed as a tool of inflationary finance and such, could possibly be altered by replacing the Fed with another institutional arrangements. The answer is that is can, if the alternative is a decentralized one in which no very large degree of influence is concentrated in a body over which the executive or Congress exercise considerable influence. Of course, even such an arrangement can be abused, but only through its being altered again. Whether that happens depends to a considerable degree on the state of professional economic opinion. For any economist to apologize for the Fed on the grounds that Congress is bound to saddle us with something at least as bad is for that economist to forget, first, that is is economists' responsibility to plead for better institutions and not to spare politicians the necessity of having to explain why they aren't following the economists advice.

David suggests that I have "truncated" the sample period used in comparing pre-Fed and Fed performance in a manner calculated to make the pre-Fed period look especially good, by leaving out the Civil War and earlier disturbances. But the sample periods I used were chosen not for such a strategic reason but (1) because the comparisons are meant to be between the Fed and the "National Currency" regime that preceded it, which was set up during the Civil War and (2) because consistent statistics for the comparisons I'm concerned with simply don't exit for earlier periods or even, in many cases, for the full National Currency period. Without such statistics comparisons become arbitrary. For the CPI, statistics David cites from before the 1780s are especially doubtful, though no-one denies that prices rose considerably during the revolutionary, 1812, and Civil Wars. That we can have inflation without the Fed is of course not a revelation. Nor does it contradict the claim that the inflation record, and the peacetime inflation record especially, has been worse under the Fed than under previous U.S. monetary regimes.

Concerning Canada's experience during the Great Depression, readers will find a very different take on this in our paper. Briefly, David sees it as proof that bad regulations rather than the Fed were to blame for the banking crisis. We see it as proof that the Fed was a poor solution to the problem of crises, that is, that there was a better, deregulatory solution. These claims aren't exactly inconsistent. But to suggest that Canada's experience should be viewed as undermining the case against the Fed is a stretch.

As for the Fed mimicking what private clearinghouses used to do: Wicker and Timberlake, the foremost authorities on that matter, both think the clearinghouse solution was better. This, too, is treated in the paper.

Once again, I'm grateful to David for inviting me to reply to his criticisms.

Saturday, December 4, 2010

George Selgin on Replacing the Fed

In reply to one of my recent posts defending the Fed's actions over the course of the recent financial crisis, a reader asked me to consider George Selgin's recent talk, A Century of Failure: Why it's Time to Consider Replacing the Fed. I'm a big fan of Selgin's work and this is definitely a video worth watching. The main purpose of this lecture is to encourage people to be less complacent in their views of the modern day institution of central banking. (A short and useful history of the 19th century debates on central banking can be found in Vera Smith's 1936 thesis: The Rationale of Central Banking.)

I have some sympathy for many of the points made by Selgin in his lecture. But as it's no fun agreeing with people, I want to offer some criticism.

I am trying to imagine myself as a layperson attending this lecture. What impression would I be left with? The main impression would be that the Fed has failed miserably in its "promise" to maintain full employment, maintain price stability, to stabilize the business cycle, and to prevent banking panics. Comparing pre and post Fed data shows this. The Fed is like the Wizard of Oz. It's time to replace the Fed (he does not have time to say with what).

My own view on this, George,  is that you are largely barking up the wrong the tree. Let me explain why.

First, people seem to have a view of the Fed as some mysterious organism with great powers and an ability to set its own agenda. It is important to remember that the Fed was created by an act of Congress in 1913. The Fed's powers and agenda are not set by the Fed; they are set by Congress. For example, the Fed's "promise" to help sustain "maximum employment" was not the Fed's idea; it was imposed upon the Fed by the Humphrey-Hawkins Full Employment Act in 1978. Many, if not most, central bankers are horrified by this legislated responsibility; and what is happening right now in the U.S. is a perfect example why.

And what are the Fed's great powers? The main power rests in the Fed's monopoly control over the supply of small denomination paper money (cash) and reserve balances (electronic version of cash). It is important to remember that this is not the only component of the U.S. money supply; most of the U.S. money supply is created by private agencies (largely in the form of electronic demand deposit liabilities that circulate from account to account in the payments system).

So, the Fed has the ability to create (and destroy) cash. But what does it do with the cash it creates? Can it simply inject it into the economy? No, not exactly. The Fed is largely restricted to using its newly printed cash to purchase government bonds. In emergency situations, it is permitted--indeed, it is expected, by the Federal Reserve Act passed by Congress--to make short-term cash loans in exchange for collateral; see my earlier post.

The Fed does not have the power to engage in helicopter drops of money.

Of course, this does not mean that Fed power cannot be abused. If the U.S. Treasury is having a hard time raising money through debt issue, it may pressure the Fed to purchase the debt with new money. Whether this is a good or bad thing obviously depends on the circumstances. But one can obviously see the incentive that politicians might have to use the Fed's monopoly to extract resources via an inflation tax. This is why the Fed tries to defend its "independence" from the Treasury to the best of its ability. At the end of the day, however, we have to recognize that Congress created the Fed -- and Congress can dismantle the Fed. This is the political reality under which the Fed must operate. Is this the Fed's fault?

Would this political reality be altered if the Fed was replaced by an act of Congress with another institution? If so, please explain.

To make the point that the Fed "failed in its promises" to deliver wonderful things, George looks at pre and post Fed economic data. The pre-Fed sample period is roughly 1870-1913. The post-Fed era is 1913-present. This is a rather convenient truncation and division of the data.

1870-1913 was a time of peace and extraordinary prosperity (punctuated by severe recessions). In contrast, the early part of the modern era featured the largest civil war  in  in the history of mankind (Europe and her current and former colonies). This was followed by the Korean war, the cold war, the Vietnam war, the war on poverty, followed by the lesser wars in Iraq wars and Afghanistan. Wars are periods of extreme fiscal strain; and it is not surprising that the inflation tax is invariably used to help finance a part of wartime expenditure. Would this have been less the case had the Fed not existed? To answer this question, let us go back further into American history, say, to 1861.


I want to label the diagram above "How to Generate Inflation without the Fed." Here is another diagram (source):


Yeah, yeah...I can see what happened in 1933. But what I want you to also look at is the run up in the price level from 1745 - 1820 (it increased almost four-fold). My general point here is that there is more to inflation than simply whether a central bank exists or not. Political factors are the deeper cause; and this is what I mean by barking up the wrong the tree.

What about the failure of the Fed to prevent the wave of bank panics during the Great Depression? George, you know better than me that there were severe regulations restricting banks from diversifying their assets across state lines. Canadian banks suffered from no such restrictions and, indeed, no Canadian bank failed during the Great Depression (though Canada, like many other countries experienced a large contraction in output). This is not to absolve the Fed from any mistakes it may have made, but there is a difference in critiquing a policy and a critiquing an institution.

What of the Fed's conduct over the recent crisis? Well, I've written about this in my earlier post. Many people do not know that the Fed was granted no supervisory role over the majority of the institutions adversely affected in the financial crisis; see my post here: Did the Fed Fail as a Financial Supervisor?

And yet, when the shit hit the fan, the Fed was expected to act immediately (and believe me, Congress was very glad to have this responsibility thrust upon the Fed at the time, and to save their Monday morning quarterbacking duties for, well, Monday morning). The Fed, in fact, essentially replicated the actions of what many of the private clearinghouses did in the past to ameliorate the adverse consequences of a financial panic.

Anyway, here you have my 2 cents worth on the matter.

Having said all this, you may find it surprising to learn that I agree with George: It is time to consider replacing the Fed. But then again, I always think it is time to consider reshaping or replacing the institutions we use to govern ourselves. Let the discussion begin!

Wednesday, December 1, 2010

The Fed's "Bailout" List Disclosed

I know that a number of you suspicious types have been waiting for this moment. I have written about the Fed's disclosure practices in the past; see, for example, here. In a nutshell, I think that disclosure is desirable, though not necessarily in real time (e.g., during a financial crisis). In any case, we have this from the Fed today:

The Federal Reserve Board on Wednesday posted detailed information on its public website about more than 21,000 individual credit and other transactions conducted to stabilize markets during the recent financial crisis, restore the flow of credit to American families and businesses, and support economic recovery and job creation in the aftermath of the crisis.

Many of the transactions, conducted through a variety of broad-based lending facilities, provided liquidity to financial institutions and markets through fully secured, mostly short-term loans. Purchases of agency mortgage-backed securities (MBS) supported mortgage and housing markets, lowered longer-term interest rates, and fostered economic growth. Dollar liquidity swap lines with foreign central banks helped stabilize dollar funding markets abroad, thus contributing to the restoration of stability in U.S. markets. Other transactions provided liquidity to particular institutions whose disorderly failure could have severely stressed an already fragile financial system.

As financial conditions have improved, the need for the broad-based facilities has dissipated, and most were closed earlier this year. The Federal Reserve followed sound risk-management practices in administering all of these programs, incurred no credit losses on programs that have been wound down, and expects to incur no credit losses on the few remaining programs. These facilities were open to participants that met clearly outlined eligibility criteria; participation in them reflected the severe market disruptions during the financial crisis and generally did not reflect participants' financial weakness.

The full press release and a link to financial transaction data is available here. I haven't had time to look through the data, but if you find anything interesting, please let me know! (I notice that information relating to the Fed's discount window operations is not available...not sure why).

Tuesday, November 23, 2010

The 2005 Real Wage Shock

In the course of preparing for my discussion of Rob Shimer's paper (see my post here), I had my RA (the tireless Constanza Liborio) dig up some aggregate wage data for the U.S. economy. Let me preface the discussion that follows by saying that I am wary of putting too much stock in aggregate wage data (the composition bias, in particular, is potentially a big problem; see here).  O.K., with this caveat in mind, let's take a look at some data.

As a measure of real wages, I use the BLS Employment Cost Index. Evidently, this measure is preferred by the likes of Bob Hall and others because it includes non-wage benefits. In what follows, I examine quarterly data for the sample period 1990:1 - 2010:3. The following chart plots the (annualized) rate of growth in nominal wages. The red line is a five-quarter rolling window I use to smooth out the series. The shaded areas represent NBER recession dates.


Prior to the most recent recession, nominal wages grew on average by about 3.5% per annum. The data shows a significant deceleration in nominal wage growth during the last recession. The composition bias suggests that actual wage growth displayed even greater "flexibility," as unemployment is typically concentrated among lower wage workers.

As I want to construct a measure of real wages, I need some measure of inflation. To this end, I use the GDP deflator, which is plotted in the next diagram.


Prior to the most recent recession, this measure of inflation averaged just above 2% per annum (the Fed's implicit inflation target). There was, however, a notable run up in the early 2000s, with (trend) inflation peaking at just over 3% in 2005 and early 2006. It is interesting to note that the rise in inflation over this period occurred while nominal wage growth decelerated. The next diagram plots the growth rate in real wages.


Now, the focus of Shimer's paper was apparent "ridigity" in real wage growth during the recent recession; a development that he interpreted as explaining the recent anemic behavior in employer recruiting intensity. As for myself, I was rather struck by the rapid deceleration in real wage growth in 2004, leading to falling real wages in 2005.

I want to take this data at face value for the moment and speculate a bit on what role these wage developments may have had in bursting of the U.S. home price "bubble" in 2006.

The story I have in my head revolves around an idea I first saw exposited by Joseph Zeira in his fine (and much under appreciated) paper: Informational overshooting, booms, and crashes

The basic idea in Zeira's paper is as follows. Imagine an asset whose dividend grows a H% per year. Everyone knows that this growth will one day come to an end. When this date arrives, the dividend grows at L% per year forever (a simplifying assumption), where L < H. The only uncertainty in this thought experiment pertains to the date of the "regime change."

Zeira demonstrates that the equilibrium (rational expectations) asset price rises over time, and continues to rise as long as dividend (read: real wage) growth expectations continue to be met. Then comes the shock.  I am tempted to call this a Wile E. Coyote moment, but of course, everyone in this model--unlike that hapless desert dog--knows that there is a date of reckoning. They just don't know beforehand when it will happen. So what happens?

Naturally, the asset price plummets like stone cast from heaven, before settling down along its new "fundamental" value (reflecting a new era of diminished expectations...gosh, I'm sounding a lot like PK these days). It appears as if asset prices "overshoot" their long-run fundamental value, before crashing.

To an outside observer, the asset price dynamics just described may be interpreted as a typical "irrational" boom and bust cycle (perhaps justifying some form of financial market regulation). In the context of the model world just described, this interpretation is completely wrong. This type of boom bust dynamic is, in fact, the natural consequence of how information is priced in an efficient asset market.

The picture I have in my head then is the following. Real wage growth appears relatively robust over the late 1990s and early 2000s. The return to labor, perhaps more than any other variable, measures the capacity for the average household to service debt. In the first half of the 2000s, creditors are looking at a recent history of relatively robust real wage growth, justifying credit expansion (even into subprime). By 2005, however, evidence of flagging fundamentals (anemic real wage growth) led to a (rational) revision downward in the real wage growth regime. Credit supply and real estate prices soon began to reflect this change in economic fundamentals.

Anyway, that's my crazy idea for the day. Feel free to share your thoughts...

Sunday, November 21, 2010

A Wile E. Coyote Moment

Paul Krugman has teamed up with NY Fed economist Gauti Eggertsson to produce a new working paper: Debt, Deleveraging, and the Liquidity Trap. Krugman provides a bit of background about this project on his blog. I see that at least a couple of people have already commented on paper; e.g., Nick Rowe and Steve Williamson. I thought that I'd join in on the fun.

And fun it is. Eggertsson and Krugman (henceforth, EK) certainly have a way with words. The imagery is splendid; my favorite, of course, being the Wile E. Coyote moment (or the Minsky moment) as reflecting the shock that unexpectedly slips the rug out from underneath the financial system.

O.K., so it's fun. But is it progress? I think it is. In particular, it's encouraging to see that the authors (Krugman, in particular, I suppose) are starting to take seriously the notion that agent heterogeneity and financial market frictions may be important elements to include in a theory of the business cycle. It should go without saying these latter two properties are the sine quibus non of modern macroeconomic modeling methodology.  As EK say in their abstract: "Making some agents debt-constrained is a surprisingly powerful assumption...". Yep, it's a real eye-opener alright. (For a few other surprises relating to the power of this assumption, see my entry here).

I want to keep this post reasonably short, so I limit myself to one (albeit important) aspect of the EK paper: the financial market friction, in the form of a debt constraint. Let me explain take a moment to explain the gist of it (for those who may be unfamiliar).

The key friction giving rise to this constraint is limited commitment (or limited enforcement). In lay terms, think about this as the unwillingness  to make good on one's promises. Taking out a loan would be no problem at all -- if debtors could be relied upon to honor their debt, in particular, by servicing it and paying it off out of their future earnings. But if debt default is a relatively low-cost proposition, then debtors may be tempted to exercise the option. To the extent that creditors anticipate these future default incentives, they are likely to restrict credit supply. The result is that people may not be able to get credit even if they are, in principle, able to pay it off.

As an aside, most people probably think of debt constraints as the consequence of "market failure" leading to an inefficiency. But as I explain here (A theory of inalienable property rights), legally imposed debt constraints might be the solution to a social problem when financial markets work too well. I mention this here because the social problem I highlight stems from heterogeneous time-discount factors, which is also a property of the EK model. In the absence of a debt-constraint, the impatient mortgage their future and embark on consumption trajectory that takes them to hell. Unfortunately for the rest of us, it is a hell that they share with the rest of society (a negative externality, in my model); so we prevent them from doing this.

Alright, back to the main story. So they have two types of agents in their model: patient and impatient. In an unfettered financial market, the latter are eventually enslaved to the former. But an exogenously imposed debt constraint prevents this extreme case from happening. Instead, the impatient hit their debt ceiling and then roll their debt over forever, paying interest to the creditors (the patient). If we call the patient agents "China" and the impatient agents "USA," we might start talking about "global imbalances." But let's not go there (though, if you're interested, you might want to go here).

And now for the Minsky moment: an unanticipated drop in the exogenous debt limit. The shock appears to be modeled as permanent. Imagine that a debtor is servicing a constant stock of $100 of debt (he'd like to borrow more, but creditors cannot secure themselves beyond $100). Following the Minsky moment, his debt limit is dropped to $75 (forever). Creditors are now worried that they cannot secure themselves beyond $75. So how does our debtor respond?

It seems to me that he will respond by defaulting on that portion of the debt he is able to; i.e., $25. I mean, why wouldn't he? It is not like he is committed to paying back debt; after all, the debt limit is rationalized in the first place by the limited commitment/enforcement friction.

And so, following a Minsky moment, we would expect a significant redistribution in wealth away from creditors toward debtors. Now that debtors have a lower cost of debt service, we can expect their consumption to increase (they are still debt-constrained, after all).

This is not, however, what happens in the EK model. Why not? Well, because following the Minsky moment, they impose the following behavioral assumption on debtors: "Suppose furthermore that the debtor must move quickly to bring debt within the new, lower, limit, and must therefore deleverage to the new borrowing constraint." [pg. 7]. Of course, this is what I assumed too. The difference is that EK assume that the deleveraging process does not entail default. Somehow, despite an implicit limited commitment friction, debtors are committed to deleveraging by paying down their debt. And, of course, paying down their debt means reducing consumption.

Is it not interesting how one is able to derive such polar opposite predictions from two plausible views of how debt is discharged following an unexpected financial market shock? Naturally, I am biased toward my view--not necessarily because it is descriptively more accurate (though we obviously do see defaults in the data) -- but because it appears logically more consistent with the frictions underlying the debt constraint in the model. If a prescribed behavior is inconsistent with the model environment, then (in my view) even more than the usual amount of caution is warranted in weighing the model's predictions and interpretation of events. (This is not to say that internal consistency is the only desired criterion of a model, of course.)

It would be interesting to explore the robustness of the EK results in the context of a model that takes the source of the debt limit (and its propensity to change) more seriously. (Not that the other shortcuts they take deserve any less attention.)  All in all, I like the paper because it at least makes at some attempt to formalize a popular interpretation of recent economic events. It's a small step forward and should, I think, spur a lively debate and future refinements...which is what our science is all about.

Thursday, November 18, 2010

Wage Rigidities and Jobless Recoveries

I recently attended an interesting conference hosted by the Atlanta Fed on Employment and the Business Cycle, where I had the pleasure of discussing this paper by Rob Shimer: Wage Rigidities and Jobless Recoveries. This was a fun paper to read, and I learned something new and interesting.

The backdrop for the paper is, of course, the recent financial crisis and associated recession. The level of GDP has essentially recovered its pre-recession level, while employment appears not to have recovered at all--these joint dynamics are referred to as a  "jobless recovery."

The hypothesis Shimer puts forth is this: [1] there was a shock (or shocks) that led to an evaporation in the value of the economy's capital stock; and [2] real wage growth is "sticky" in the sense that it appears insensitive to macro shocks.

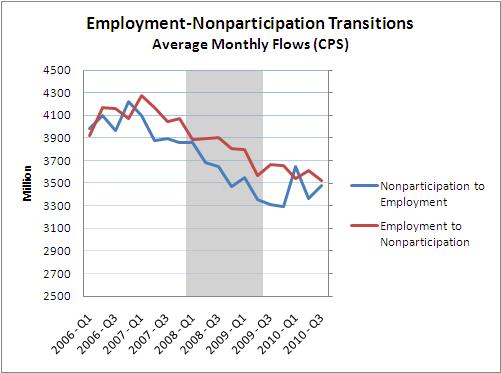
The type of evidence that lends some support for this latter hypothesis is displayed in the following diagram (also used by Bob Hall in his talk).


As an aside, I personally do not find such evidence wholly compelling. First, I think that composition bias is a big problem in the aggregate data; i.e., the first people to be let go in a recession are the least productive. Second, I have personal experience in the construction sector that leads me to believe that actual wage flexibility is much greater than what is recorded in official statistics. But in any case, I'm not here to argue about the evidence; let me take it as a fact that real wage growth is "sticky" in the sense described above. (Note: the basic story goes through as long as the real wage is not perfectly flexible).

To begin, consider a standard neoclassical growth model and let us consider a point on along the balanced growth path, where output and wages are growing, and employment (per capita) remains fixed over time.

Now, imagine that we shock the economy by evaporating some fraction of its capital stock. The subsequent transition dynamics are familiar to macroeconomic theorists and there is no need to describe them in detail here. The important thing is that real wages initially fall (since labor productivity falls and wages are flexible) and that the economy eventually returns to its balanced growth path.

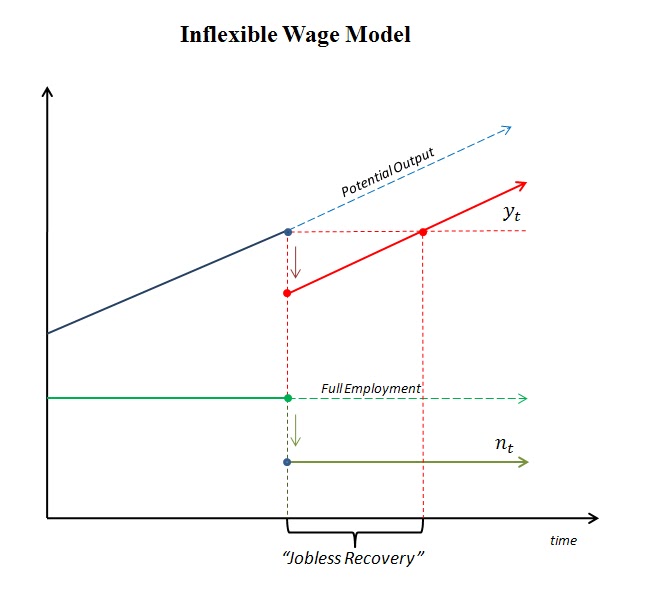
Next, let us repeat the experiment, but assuming instead that real wages continue to grow along their balanced growth path (that is, the real wage does not respond to the shock). What do the subsequent transition dynamics look like? My own expectation was that the economy would once again return to its balanced growth path, but that the period of transition would be extended owing to the assumed rigidity in the real wage. Everyone I quizzed about this had the same expectation.

Surprisingly, to me at least, this intuition turns out to be completely wrong! Output and employment drops on impact, but then output stays along its new balanced growth path, with employment remaining below full employment forever; see the following diagram.


Now, I have to admit that my first thought at reading this result was that it must surely be wrong. But, of course (this is Shimer after all), it turns out to be correct. You can verify this for yourself by reading the paper. But as this will probably take more effort than you're willing to expend, let me give you a much simpler example that conveys the basic intuition.

An OLG Model

People live for 2 periods and they value consumption only in the last period of life; write the utility function of a person born at date t as Ut = ct+1. This simplifying assumption implies that the young save all their income.

The young are each endowed with one unit of time, which they supply inelastically to the labor market. Let N denote the population of young workers; and assume that N remains constant over time. Let wt denote the real wage at date t.

The old are in possession of the economy's capital stock Kt. The old hire young labor at the prevailing wage, produce output, and then consume the profit (the return on capital). Capital depreciates fully after it is used in production.

There is a standard neoclassical production technology Y = F(K,N) satisfying Y = f(k)N, where k = K/N is the capital labor ratio. Let F be Cobb-Douglas and let 0 < α < 1 denote capital's share of output. Then we have f '(k)k = αf(k).

Now, the demand for labor satisfies: wt = FN(Kt,Ntd) and the supply of labor satisfies Nts = N. In a competitive equilibrium, the real wage must satisfy:

[1] wt = FN(Kt,N) = (1 - α)f(kt); where kt = Kt/N.

In what follows, I set the exogenous growth rate to zero, since doing so is not important for explaining the main result. Now, as the young save all their earnings, it follows that the next period capital stock (per young person) is given by:

[2] kt+1 = (1 - α)f(kt)

In other words, the dynamics are equivalent to the standard Solow model we teach to undergrads. The nondegenerate steady state capital-labor ratio is characterized by:

[3] k* = (1-α)f(k*)  [Note that k* = w* ]

Alright then. Begin at a point on the balanced growth path (here, a steady state with zero growth) and evaporate some capital, so that K0 < K*. This is a crude way to model the impact effect of a financial crisis. The transition dynamics should be familiar to any student of the Solow model; in particular, see [2]. In a decentralized version of this model, employment remains fixed at N, but the real wage (and the real wage bill) initially declines, before transitioning back to their original steady state values.

O.K., now let's repeat this experiment, but this time under the assumption that the real wage remains fixed at its initial steady-state value, wt = w* for all t. In this case, the level of employment N < N is determined the demand for labor; i.e.,

[4] w* = FN(K0,N0) = (1 - α)f(k*) = k*

Condition [4] implies that the capital-labor ratio remains unchanged; i.e., K0/N0 = k*. That is, the demand for labor declines in proportion to the decline in the value of capital. Since the real wage is fixed, this also implies that the aggregate wage bill declines in the same proportion. And since the wage bill here constitutes the saving that finances new capital, we have:

[5] K1 = w*N0 = K0 [since N0 = K0/k* and k* = w* ]

In other words, the capital stock remains forever fixed at K0 < K* and the level of employment remains forever fixed at N0 < N.

This is a permanent depression! If we extend the model to allow for exogenous growth, the level of employment remains depressed, but the level of output grows and eventually recovers its original level (this is the jobless recovery phase). However, the level of output remains forever below its "potential." Interesting.

Labor Market Search
 
One of the drawbacks of the model above is that both firms and workers stand to gain by negotiating the real wage downward following the shock. There is nothing in this model that prevents agents from exploiting these gains from trade, so ruling it out exogenously seems wrong (even if it is deemed realistic).

To address this shortcoming, Shimer extends the neoclassical model with the competitive labor market replaced by a search market, with bilateral meetings and negotiations. One of the nice things about the search specification is that the real wage may remain fixed in an equilibrium (if the shock is not too large). In other words, there need not be any inefficiency associated with a fixed wage at the individual level (though, it may induce an inefficiency at the aggregate level).

Shimer shows that the search model with rigid real wages generates dynamics that closely resemble those generated by a standard neoclassical model with rigid real wages. There appears to be an added force at work in the search model though. In particular, the combination of the negative shock and fixed real wage (along its balanced growth path) serves, in a way, to redistribute bargaining power from firms to workers. This is bad news for job creation, because the returns to investing in recruiting activities is now diminished, leading to a prolonged decline in employment. Sounds familiar.

In my view, this is an argument that deserves to be taken seriously. How seriously depends on how seriously one takes the "rigid real wage" hypothesis. Christopher Pissarides has criticized the assumption on the grounds that, in reality, real wages for new hires (or job changers) appear to be quite flexible relative to workers who remain employed. And, as Pissarides points out, the wages of incumbent workers do not factor into hiring decisions in a search model (assuming that the firm is not credit constrained). The key price as far as recruiting is concerned is the expected wage demands of future employees; and these appear to be relatively flexible.
 
This is all very interesting stuff. Almost makes me want to work in the area again!

P.S. The policy implications also turn out to be very interesting. Despite the "Keynesian" sticky wage property of these models, fiscal stimulus in the form of an increase in government purchases has the effect of crowding out capital investment, with no effect on employment. On the other hand, fiscal policies that subsidize business sector hiring (like a cut in the payroll tax) appear to be effective.

Wednesday, November 17, 2010

QE2 in Five Easy Pieces

A lot of people appear confused about QE2 and the Fed has recently come under a lot of attack following its recent announcement. Well, maybe the following will help a bit.  James Bullard, president of the St. Louis Fed, recently delivered a speech on QE2 entitled QE2 in Five Easy Pieces. For those that are interested, you can view his presentation slides here.

Monday, November 8, 2010

Ron Paul on the Fed Again

I have to admit that I like listening to the little guy speak. My view of Ron Paul (and yes, I have read End the Fed, though I haven't had time to comment on it yet) is that he is a smart guy with good instincts and a good understanding of the events that have shaped monetary history in the U.S. and elsewhere. (This is unlike PK who, while also very smart, appears to have shaped his macroeconomic theory entirely on the apparent failure of a local babysitting cooperative).

Here is Ron Paul's attack on the Fed today: Fed Will Self-Destruct. I don't necessarily disagree with any of the points made in the written article (apart from the fact that Bernanke has never advocated 4% inflation). Some of the things he says in the video interview, however, seem rather strange.

With respect to our "deeply flawed monetary system" he appears to be concerned that one person (Bernanke) has the power to create $600B with the stroke of pen (out of thin air) and then spend it (foolishly).

Note: while the Fed is indeed able to create cash (or reserve balances) "out of thin air," under normal circumstances, the Fed is effectively prevented from spending this cash on anything other than U.S. government bonds. These bonds are also created "out of thin air" (they exist almost exclusively in book entry form). When the Fed purchases government bonds, it is really just swapping one form of air for another.

When phrased in this way, it becomes a little harder to see why a swap of Fed air for Treasury air should be inflationary (though note, his definition of inflation is money creation -- so of course he sees inflation everywhere, even though price-level inflation remains anemic).

Wednesday, November 3, 2010

What is Clear and Not so Clear About Fed Policy (Part 2)

Today's FOMC statement is available here: FOMC November 03, 2010. Thought it might be a good time to follow up on my earlier (September 23) post: What is Clear and Not so Clear About Fed Policy.

On September 23, I said the following (let me summarize):

What was clear: The Fed will stand ready to do "whatever it takes" to make sure inflation expectations remain anchored at around 2% per annum. With inflation still on the low side of this target and the labor market still weak, it is not surprising that the Fed today a program to expand the size of its balance sheet.

What was not so clear: The Fed was not clear on the tactics it meant to employ to anchor long-term inflation expectations. I suggested that a good bet would be a program designed to purchase longer-dated treasuries, with purchases following a state-contingent rule (depending on how economic events turned out). This is what we got:
To promote a stronger pace of economic recovery and to help ensure that inflation, over time, is at levels consistent with its mandate, the Committee decided today to expand its holdings of securities. The Committee will maintain its existing policy of reinvesting principal payments from its securities holdings. In addition, the Committee intends to purchase a further $600 billion of longer-term Treasury securities by the end of the second quarter of 2011, a pace of about $75 billion per month. The Committee will regularly review the pace of its securities purchases and the overall size of the asset-purchase program in light of incoming information and will adjust the program as needed to best foster maximum employment and price stability.
Well, looks like I was half right. What surprised me here were the stipulated size and time limits; i.e., $600B figure by 2011:Q2. Why $600B and not $500B or $700B? No idea. Why 2011:Q2 and not 2011:Q1 or 2011:Q3? No idea.

The coexistence of the "state-contingent" and "size/time limit" language in the statement above may reflect a possible compromise between groups arguing for one or the other. But the "size/time limit" language seems somewhat redundant in my view; at least, given that we believe that the Fed is commited to 2% inflation. For example, what happens at the end of 2011:Q2 if inflation is still running at 1% with unemployment near double digits? Answer: a likely repeat, going further out along the yield curve, if necessary. But this is likely to happen (under the hypothesized contingency) whether or not these size/time limits were in place to begin with.

Finally, what was downright blurry in my previous post continues to remain hazy, in my view.

Tuesday, November 2, 2010

Bumper Stickers: Election 2010

Pretty much sums up the mood of the country, I'd say... (I saved the best one for last).


Friday, October 29, 2010

The Cyclical/Structural Unemployment Debate

There's been a lot of talk these days about whether unemployment in the U.S. today is the product of "cyclical" or "structural" factors. For example, see: And he huffed...and he puffed...and he blew the structural unemployment house down!

This blustering (by the big bad blog wolf) brings back a fond memory. In the fall of 1988, I had the good fortune of being enrolled in a PhD macro class taught by  Peter Howitt. Peter had just returned from sabbatical leave (at MIT, if memory serves) and perhaps it was there that he picked up on the labor market search literature. (I should like to point out that he has a very nice paper on the subject, coauthored with Preston McAfee, published in 1987: Costly Search and Recruiting).

Anyway, it was in that class that the first learned of the "cyclical vs structural" debate. Evidently, the modern version of this debate started out with Lilien's "Sectoral Shifts and Cyclical Unemployment" paper (JPE 1982). Abraham and Katz countered with "Cyclical Unemployment: Sectoral Shifts or Aggregate Disturbances?" (JPE 1986).

One part of the AK counterargument exploited Beveridge curve evidence. I understood their argument as saying that if structural shifts are the primary driving force, then one would expect to see a positively sloped Beveridge curve (much like what we are seeing right now in the U.S.).  In fact, the Beveridge curve is negatively sloped. Ergo, aggregate demand shocks yes; structural shifts no.

As I had just finished reading Pissarides' now-famous AER 1985 piece, I knew exactly what AK were on about. And so, why not formalize the AK hypothesis in a Pissarides-style search model? (We were all scheduled to present a short seminar in Peter's class on a research topic, and this sounded as good as any). Now, let me describe the model I wrote down and what I discovered.

The model

The model I used was a simplified version of Pissarides (AER 1985).

The economy consists of a fixed number of workers (mass normalized to unity) and a potentially "large" supply of jobs (or firms--I use the two terms interchangeably). Each job requires one worker. A firm-worker pair produce y units of output. (I assumed y to be common across matches, but allowed y to vary over time as an exogenous stochastic process).

Workers did not have any interesting decisions to make in the model. At any point in time, they were either matched with a firm or not. If they were matched, they produced output. If they were not matched, they used their fixed time endowment in search activity. Unmatched workers were "involuntarily" unemployed (because, by assumption, even menial jobs do not exist). Let u denote the unemployment rate at an arbitrary date (employment is given by n = 1 - u ).

Central to this literature is the notion of an aggregate matching function. The idea is that the aggregate recruiting intensity of firms (measured by vacancies v ) and the aggregate search intensity of workers (measured by unemployment u ) combine in some "black box" search market to produce an aggregate flow of new matches m. Formally, m = M(u,v), where M(.) was frequently specified as Cobb-Douglas (the rationale for CRS being that the ratio θ ≡ v/u displayed no secular trend in the data).

Now, Jeremy Greenwood had introduced me the year before to RBC theory. The idea there was that aggregate production possibilities, as measured by an aggregate production function y = zF(k,n) might bounce around owing to exogenous movements in aggregate productivity, z. It occurred to me that the AK hypothesis might be formalized by assuming that the efficiency of the aggregate matching function is subject to time variation owing to "structural" disturbances. That is, why could I not write m = xM(u,v), where x is analogous to the productivity shock in the RBC literature?

The idea is that a structural shock that (say) required sectoral or occupational reallocation is likely to reduce the efficiency with which matches are formed at the aggregate level (a lower x ). A lower x, in turn, would cause an "outward" (thanks, Nick) shift of the theoretical Beveridge curve, leading to the AK observation that structural shocks should induce unemployment and vacancies to move in the same direction. I was getting excited. But then, I was still young back then.

Alright then, back to the model. Following Pissarides, I denoted qm / v and pm / u as the match probabilities for vacant firms and unemployed workers, respectively. Utilizing the CRS matching technology about, we can write these match probabilities as functions of the "labor market tightness" variable θ (as well as the structural shock x, which I leave implicit). It turns out that q(θ) is a decreasing function of θ; more vacancies competing for the pool of unemployed reduces each firm's chances at making a match. Likewise, p(θ) is an increasing function of θ; more vacancies makes it easier for the unemployed to find work.

Firms and workers bargain over the output produced in a match. I assumed, for simplicity, that the wage is given by w = αy; where 0 < α < 1 is a parameter indexing the worker's bargaining power.

At the beginning of the period, the firm-worker match breaks up with probability 0 < σ < 1. Call this the separation rate. Let 0 < β < 1 denote the discount factor. If the value of a firm without a worker is normalized to zero, then the capitalized value of a firm with worker is simply the expected discounted stream of profits. If I let J denote the capital value today, and J+ the capital value tomorrow, then we have the following Bellman equation:

[1] J = (1 - α)y + (1 -σ)βE[J+ | ω]

The term E[J+ | ω] denotes the expected future value of firm operations, where the expectation is formed conditional on information ω.

Notice that I can embed the usual RBC assumption of persistent aggregate productivity shocks by assuming that ω = y. Or, we might model aggregate demand shocks as exogenous shifts in ω (my preferred interpretation is that these are news shocks). Absent any aggregate uncertainty, we can impose J = J+ and solve for the steady state capital value J*; i.e.,

[1a] J* = (1 - α)y / [1 - (1 - σ)β]

The next step is to figure out what determines aggregate recruiting intensity. Assume that posting a vacancy incurs the resource cost κ. Then, assuming free-entry in vacancy creation, the equilibrium labor-market tightness variable θ is determined by:

[2] q(θ)(1 -σ)βE[J+ | ω] = κ

The formulation above assumes that even newly created matches are subject to exogenous separation in the following period. In any case, note that since u is predetermined, condition [2] pins down equilibrium vacancies v. That is, v is a "jump variable" that responds instantaneously to any shock. If an increase in ω results in an increase in the value of a firm, for example, the effect will be to increase vacancy creation. As new vacancies come online, the probability of successfully finding a worker falls, until condition [2] is again satisfied.

Note that we can combine [1a] with [2] to determine the steady-state labor market tightness variable:

[2a] q*)(1 -σ)βJ* = κ

Finally, we need an expression that describes the evolution of the equilibrium unemployment rate. This is given by u+ = u + σ(1-u) - (1-σ)p(θ)u; or

[3] u+ = σ + [ 1 - (1-σ)(1-p(θ)) ]u

The steady-state version of [3] is given by:

[3a] u* = σ / [ 1 - (1-σ)(1 - p*) ]

That's it. What a beautiful little model. Note its lovely recursive structure: condition [1] determines J; given J, condition [2] determines θ; and given θ, condition [3] determines the unemployment rate.

Moreover, the model generates a nice downward sloping Beveridge curve. That is, an increase in aggregate demand (an increase in ω that increase J+) stimulates v, which reduces u. A structural shift that reduces matching efficiency (a reduction in x) shifts the Beveridge curve outward. Wonderful.

And so, following the RBC methodology I learned from Greenwood, I parameterized the model and calibrated the steady-state to some data. I specified the usual AR(1) process for the aggregate technology shock. And I added an AR(1) process for the match-efficiency (structural disturbance) shock. Then I simulated the model output for unemployment and vacancies under two scenarios. First, I shut down the structural disturbance, assuming only the TFP shock. And then I shut down the TFP shock, assuming only the structural disturbances.

To my surprise, both experiments generated downward sloping Beveridge curves (in the sense that unemployment and vacancies were negatively correlated). The correlation was a bit weaker under the structural shocks (something like -0.50 vs. -0.80, if I remember correctly). But the correlation was still negative! (I am going to assume that this was not the product of a coding error!)

In any case, during my class presentation, I explained the result as follows. Imagine hitting this model economy with a structural disturbance that manifests itself as a decrease in matching efficiency. In terms of condition [2], this is like a negative technology shock to the match probability q(θ). On impact, the unemployment rate remains fixed; hence, all the adjustment must be absorbed by the "jump" variable, vacancies. And if firms now find it harder to match, vacancies are going to jump down. The contraction in job availability then manifests itself as a higher (future) unemployment rate. Could the logic supplied by Abraham and Katz in refuting Lilien's hypothesis be wrong? Maybe.

Lessons

I don't want to make too much out of this simple model. One reason not to like it for the question at hand is that it is only a one-sector economy (though, my classmate, Paul Storer, eventually produced and estimated a very nice two-sector model here). 

The point here is not to say who is right and who is wrong. Maybe the Abraham and Katz hypothesis is correct...or maybe it is not. I don't know. The important thing, in my mind, is what I learned from this experience; namely, to be very careful in accepting too quickly (or too uncritically) predictive statements based on informal stories.