I haven't had time to do much blogging lately. But I have been studying the recent burst of inflation and thinking of how to interpret what we're experiencing. As is my way, I decided to write down a little model (a dynamic general equilibrium model) to help organize my thinking on this question. Below, I summarize the interpretation stemming from the model (available on request). Because it's a model, it does not capture everything that one might think isimportant. But I think it certainly captures some of the main forces operating on the U.S. economy over the 2020-2022 time period. And if so, then it offers a different take on how to interpret the recent episode of (relatively) high and (hopefully) transitory inflation. I look forward to any feedback. DA
Introduction
In February 2020, the month before the full effects of the pandemic were felt in the United States, PCE and CPI measures of inflation were running between 1.7% and 2.4%, consistent with the Federal Reserve's official 2% target inflation rate. From March 2020 to February 2021, these measures of inflation declined significantly, with most measures falling below 1% in May 2020, before recovering to somewhere near 1.5% by February 2021. In March 2021, measures of inflation began to rise sharply and significantly. By February 2020, the month prior to the Russian invasion of Ukraine, PCE and CPI inflation rates rose to between 5.4% to 8.0%, with core PCE peaking in that month. Other measures of inflation peaked in the summer of 2022. Inflation has been declining slowly and steadily since then. Most outlooks have inflation declining to between 2% and 3% by the end of 2024.
If inflation continues along its projected path to settle in at or even somewhat above 2%, then the recent inflation dynamic will be hump-shaped, beginning in 2021, peaking in 2022, and falling significantly in 2023; see Figure 1.
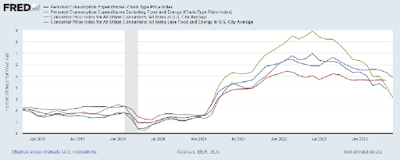 |
| Figure 1 |
How should we interpret the hump-shaped inflation dynamic in Figure 1? The answer to this question is critically important because an evaluation of monetary and fiscal policy over this episode requires a proper interpretation of the phenomenon being studied. More than one interpretation is possible, of course. But any useful interpretation will have to rely on theory at some level. The goal of this paper is to develop a dynamic general equilibrium model that can explain the qualitative properties of data in an empirically plausible manner and be used to assess the monetary and fiscal policies employed since March 2020.
An overview of the argument
Views on the causes and nature of the "COVID-19 inflation" vary considerably. There is no doubt an element of truth to many of these views and my interpretation below relies on more than one causal factor.
Beginning in March 2020, there were the supply disruptions induced by the pandemic. Some sectors of the economy, like leisure and hospitality, were virtually shut down in an attempt to "flatten the curve." Individuals stopped patronizing establishments delivering in-person services. The prime-age employment-to-population ratio fell from 80% to 70% from February to April in 2020 and did not recover its initial level for another two years. Severe disruptions in the global supply chain led to shortages of goods at final destinations. At the time these COVID-19 related shocks had more or less dissipated, additional disruptions emerged with the Russian invasion of Ukraine in late February 2022 along with growing Sino-American tensions.
These "supply side" shocks were real and significant. It is not entirely clear, however, how they might be used to understand the inflation dynamic in Figure 1. The intensity of the "supply side" shock likely peaked in 2020, a year in which inflation declined. And the Russia-Ukraine war shock appeared in 2022, after the sharp rise in inflation in 2021. Of course, these observations do not mean that supply disruptions had no effect on the inflation dynamic. But they do suggest that other forces were likely at work.
Other important forces were surely at work on the "demand side" of the economy. Exactly what these forces were and how they should be modeled remains an open question. Guerrieri, Lorenzoni, Straub, and Werning (2022) demonstrate how a negative sectoral supply shock in an incomplete markets setting can endogenously result in "deficient demand" (a decline in actual output in excess of the decline in potential output). Although their paper does not focus on inflation dynamics, the mechanism they identify is presumably disinflationary; at least, on impact.
Another way in which demand can be affected is through expectations. Developed economies devote significant amounts of time and resources to activities broadly classified as investments, including business fixed investment, residential investment, human capital accumulation, and job recruiting. The contemporaneous demand for goods and services devoted to investment (broadly-defined) surely depends on its expected rate of return. Indeed, there is considerable evidence suggesting that this is the case; see Liao and Chen (2023) and the references cited within. Whether these expectations are driven by news over economic fundamentals (e.g., Beaudry and Portier, 2006) or by purely psychological factors (e.g., Keynesian "animal spirits") matters little for positive analysis. Depressed expectations over the return to investment will depress investment demand whether expectations are formed rationally or not. The manner in which expectations are formed does, however, have implications for monetary and fiscal policy.
The analysis below assumes a large "negative sentiment shock" in 2020, consistent with the fear and uncertainty associated with the unfolding pandemic and the dramatic measures taken to shut down parts of the economy. When the outlook on investment returns darkens, investors typically seek safe havens. During the financial crisis of 2008-09, U.S. Treasury securities served as a "flight to safety" asset. The result was plummting bond yields. To the extent that interest rates do not (or cannot) move lower, the demand for safety expresses itself as a decline in capital spending and the price-level. That is, a negative sentiment shock is disinflationary; at least, on impact. Below, I assume that this negative sentiment shock largely reversed itself in 2021, consistent with the appearance and widespread use of COVID-19 vaccines in that year.
Now, imagine for the moment, that monetary and fiscal policy remained roughly unchanged from 2019 to today. That is, imagine that the Fed did not lower its policy rate in March 2020 and that the large discretionary fiscal programs (primarily the CARES Act of 2020 and the American Rescue Plan of 2021) had not been implemented.
Assume that the negative sentiment shock was significantly more powerful than the negative supply shock in 2020, in line with Guerrieri, Lorenzoni, Straub, and Werning (2022). Assume that these two shocks are largely reversed in 2021. Then the supply-demand framework sketched above suggests a large disinflationary impulse and recession in 2020, followed by an equally large inflationary impulse and economic recovery in 2021. Depending on the nature of adjustment costs, employment and inflation should have more or less returned to their pre-pandemic levels by 2022 or shortly thereafter. To a first approximation, this is essentially what happened. However, actual inflation turned out to be much higher and more persistent than can be rationalized by these shocks alone. What is missing?
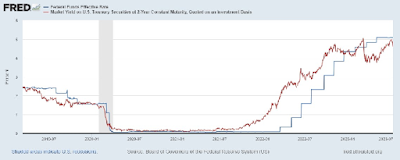
What is missing, of course, are the monetary and fiscal policy responses implemented at the start of the crisis. In March 2020, the Fed lowered its policy rate from 150bp to essentially zero where it remained until March 2022. The anticipated monetary tightening began in late 2021 (see the 2-year rate in Figure 2). From March to December of 2022, the federal funds rate rose by over four hundred basis points.
 |
| Figure 2 |
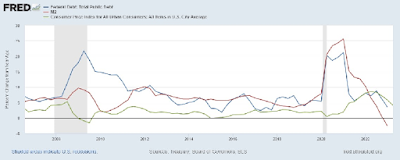
From 2020 to 2021, the U.S. Congress passed a number of bills described as delivering "stimulus and relief." The two largest bills were the CARES Act, passed in March of 2020, and the American Rescue Plan (ARP), passed in March 2021. In broad terms, these spending packages had the following properties. First, the consisted largely of monetary transfers targeting the bottom half of the income distribution as well as distressed businesses. Second, the spending packages were large--around $2 trillion each--over ten percent of GDP in both 2020 and 2021. Third, the spending packages were not offset by spending reductions in other areas. Nor were surtaxes levied to finance the programs. The programs were financed with net new issuances of nominal securities purchased by the banking sector. That is, the transfers essentially took the form of "helicopter drops" of money; see Figure 3.
 |
| Figure 3 |
The ultra loose monetary and fiscal policies over 2020-21 exerted strong inflationary pressures. In 2022, the Russian-Ukraine war contributed to headline inflation. The output loss in 2020 contributed to inflationary pressure. The reversal in business sentiment in 2021 contributed to inflationary pressure.
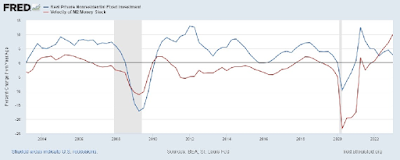
The inflationary pressures cited above were offset by strong deflationary pressures in 2020 and 2022. In 2020, there was a strong negative demand shock, resulting in a strong decline in investment with an accompanying movement in the demand for money (the inverse of money velocity); see Figure 4.
 |
| Figure 4 |
As business sentiment reversed in 2021, the demand for money (safe assets, in general) declined. This turn of events occurred just as the ARP kicked in. Together, these two events generated a strong inflationary impulse in 2021. This impulse was counteracted in 2022 by strongly contractionary monetary and fiscal policies (a sharp rise in the policy interest rate in 2022 and the expiration of the ARP by the end of 2021).
The account given above is based on a model that I formalize below. Note that the account is purely qualitative in nature. This is because my model is designed only to flesh out the qualitative effects of a variety of economic forces that seem plausibly important (I am working on a quantitative version of the model with a coauthor). Formalizing the argument above through a simple dynamic general equilibrium model has two benefits. First, it will force me to be explicit about the assumptions I am making to render the verbal interpretation above logically coherent. Second, it will allow me to evaluate monetary and fiscal policies employed in the 2020-22 period. The model can also be used to perform counterf actuals.
Policy assessment
The model suggests the following assessment.
1. Cutting the policy rate in March 2020 was appropriate only to the extent that there were forces driving a declining output below potential. A strong deflationary pressure is not sufficient to identify an "output gap," because rationally-pessimistic forecasts are deflationary. One would have to make the case that investors became overly-pessimistic. Or that sectoral shocks somehow led to deficient demand (Guerrieri, et. al., 2022). These are difficult arguments to make because "potential" is unobservable and prior to the arrival of the vaccines, a gloomy sentiment did not seem irrational.
2. The fiscal transfers associated with the 2020 CARES Act were desirable. The policy mostly redistributed purchasing power (at a time when total output was declining) from high to low-income persons (the latter group being disproportionately affected by the shutdowns). Without the CARES Act, the economy would have likely experienced a significant deflation (benefiting those with wealth in the form of money/bonds). Hence, the desired redistribution was financed through an inflation tax. A temporary income or consumption tax might have been used instead. In this sense, inflation was at least in part an efficient tax (or constrained efficient, better ways of financing the desired transfers were available).
3. A case could be made that the 2021 ARP was desirable ex ante. A case could be made that it was undesirable ex post. Either way, the model suggests that the ARP was implemented at precisely the time investor sentiment had returned to normal. Essentially, 2021 saw a large increase in the supply of money and a large decrease in the demand for real money balances. Both effects served to drive inflation higher.
4. Strong disinflationary policies were enacted at the beginning of 2022. First, fiscal policy became highly contractionary (by ceasing the ARP). Second, the Fed began to raise its policy rate aggressively. These disinflationary policies were partially offset by the inflationary consequences of growing geopolitical tensions.
My own assessment of monetary and fiscal policy over this period of time (based in part on my model) is as follows. First, the Fed should not have lowered its policy rate in March 2020 (its emergency lending programs worked as needed). Conditional on having lowered the policy rate (forgivable, in light of the weak inflation numbers), the Fed should have begun tightening sometime in 2021 (consistent with the recommendations of those economists who favor NGDP targeting). Second, despite all its warts, the CARES Act was essential and did what it needed to do. Third, desirability of the ARP is better weighed in political, rather than economic, terms. It was a redistribution policy. It was financed through an inflation tax. It might have been financed in some less-inflationary way. But a tax in some form would have been unavoidable.
The policies and programs put in place by our elected representatives to meet the economic challenges inflicted on us by the pandemic were designed to redistribute purchasing power. If those policies were widely viewed as desirable, then it seems strange to blame inflation (or some other tax) for inflicting economic hardship. Inflation was mainly a symptom of the solution to a problem inflicted on humanity by nature. This is the sense in which one can describe the recent inflationary episode as "constrained efficient inflation."
PS. If the hump-shaped inflation pattern continues to play out, it will be judged by economic historians as a "transitory" inflation. There is nothing in the model which suggests that a recession is necessary for the transitory part. A helicopter drop of money creates a transitory inflation. This is textbook economics.